

Question: 2a . Monopoly outcome versus competition outcome Consider the weekly market for gyros in a popular neighborhood close to campus. Suppose this market is operating
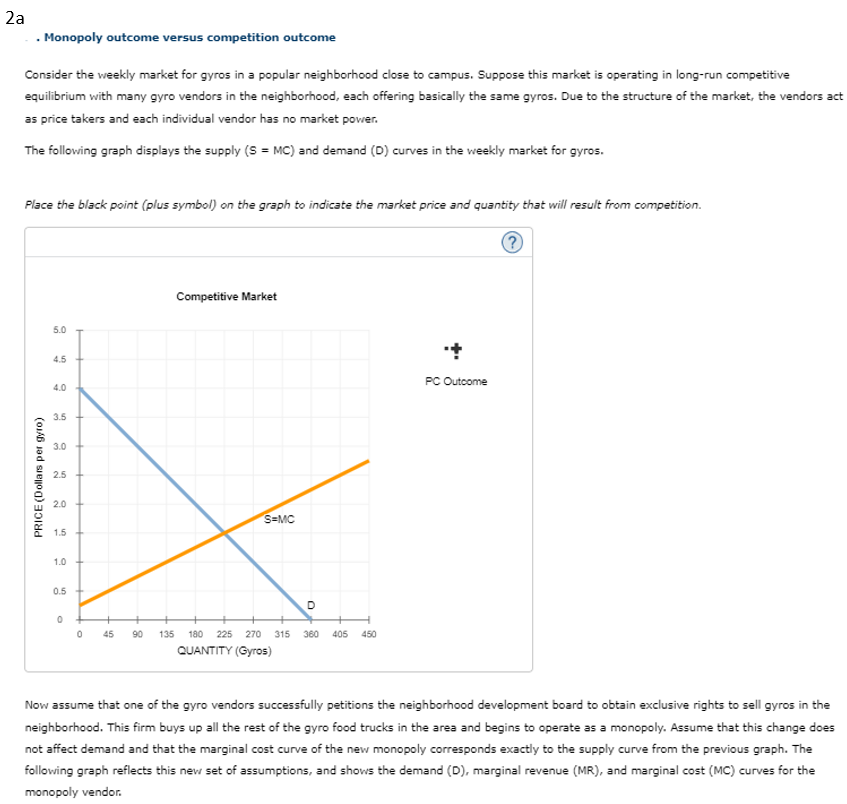
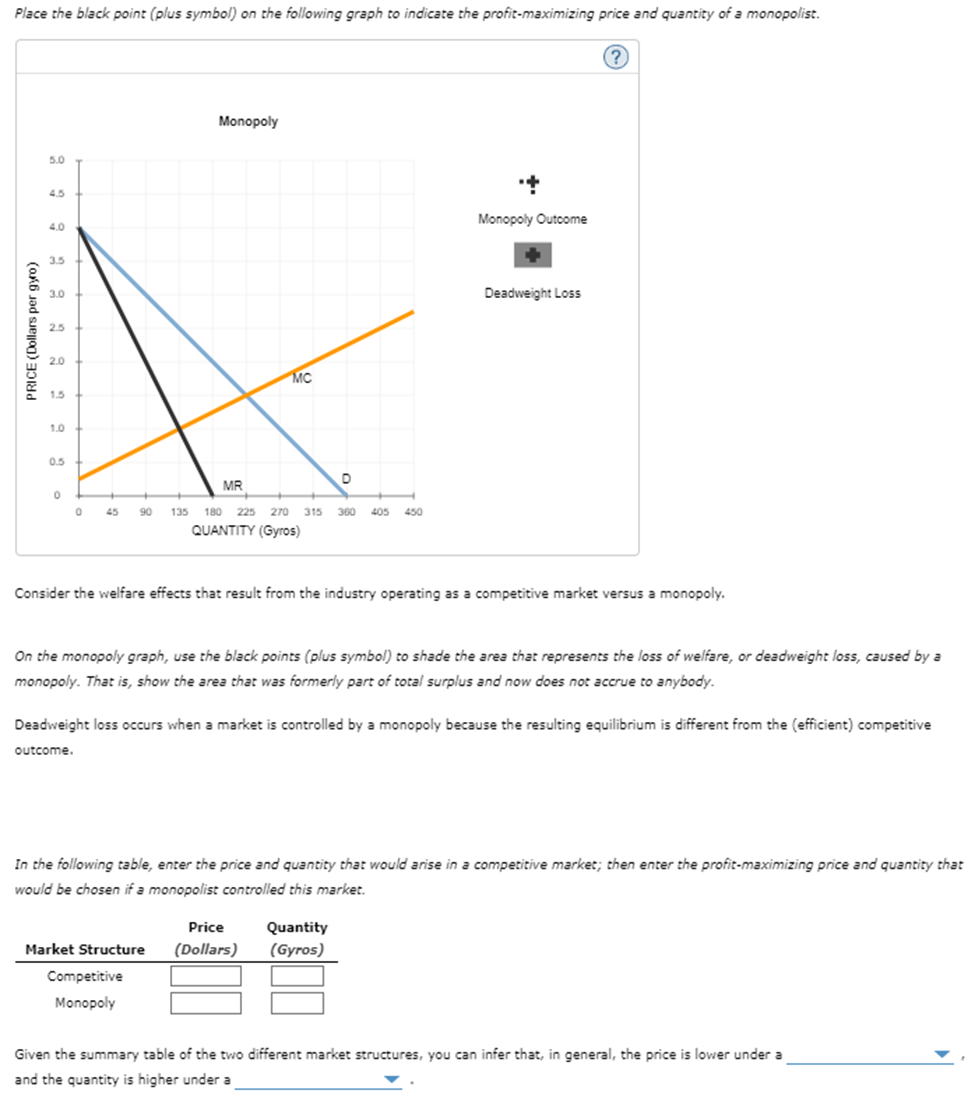
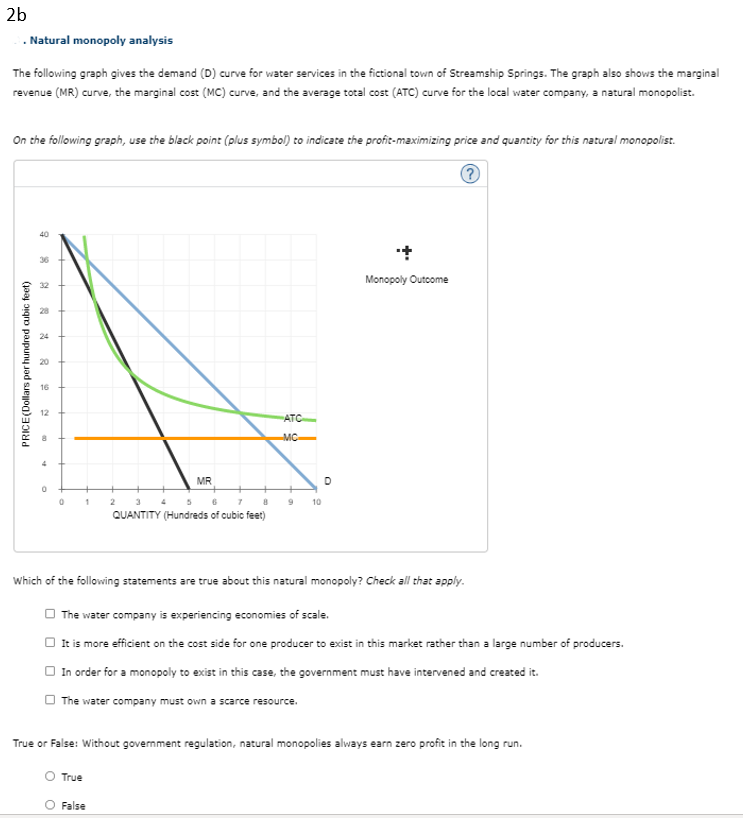
2a . Monopoly outcome versus competition outcome Consider the weekly market for gyros in a popular neighborhood close to campus. Suppose this market is operating in long-run competitive equilibrium with many gyro vendors in the neighborhood, each offering basically the same gyros. Due to the structure of the market, the vendors act as price takers and each individual vendor has no market power. The following graph displays the supply (S = MC) and demand (D) curves in the weekly market for gyros. Place the black point (plus symbol) on the graph to indicate the market price and quantity that will result from competition. Competitive Market 5.0 4.5 4.0 PC Outcome 3.5 PRICE (Dollars per gyro) 2.5 2.0 S=MC 1.5 1.0 0.5 90 135 180 225 270 315 360 405 450 QUANTITY (Gyros) Now assume that one of the gyro vendors successfully petitions the neighborhood development board to obtain exclusive rights to sell gyros in the neighborhood. This firm buys up all the rest of the gyro food trucks in the area and begins to operate as a monopoly. Assume that this change does not affect demand and that the marginal cost curve of the new monopoly corresponds exactly to the supply curve from the previous graph. The following graph reflects this new set of assumptions, and shows the demand (D), marginal revenue (MR), and marginal cost (MC) curves for the monopoly vendor.Place the black point (plus symbol) on the following graph to indicate the profit-maximizing price and quantity of a monopolist. ? Monopoly 5.0 .+ 4.5 4.0 Monopoly Outcome + Deadweight Loss PRICE (Dollars per gyro) MC G 0.5 MR 90 135 180 225 270 315 360 405 450 QUANTITY (Gyros) Consider the welfare effects that result from the industry operating as a competitive market versus a monopoly. On the monopoly graph, use the black points (plus symbol) to shade the area that represents the loss of welfare, or deadweight loss, caused by a monopoly. That is, show the area that was formerly part of total surplus and now does not accrue to anybody. Deadweight loss occurs when a market is controlled by a monopoly because the resulting equilibrium is different from the (efficient) competitive outcome. In the following table, enter the price and quantity that would arise in a competitive market; then enter the profit-maximizing price and quantity that would be chosen if a monopolist controlled this market. Price Quantity Market Structure (Dollars) (Gyros) Competitive Monopoly Given the summary table of the two different market structures, you can infer that, in general, the price is lower under a and the quantity is higher under a2b . Natural monopoly analysis The following graph gives the demand (D) curve for water services in the fictional town of Streamship Springs. The graph also shows the marginal revenue (MR) curve, the marginal cost (MC) curve, and the average total cost (ATC) curve for the local water company, a natural monopolist. On the following graph, use the black point (plus symbol) to indicate the profit-maximizing price and quantity for this natural monopolist. 40 .+ Monopoly Outcome PRICE (Dollars per hundred cubic feet) ATC MR D 9 10 QUANTITY (Hundreds of cubic feet) Which of the following statements are true about this natural monopoly? Check all that apply. The water company is experiencing economies of scale. O It is more efficient on the cost side for one producer to exist in this market rather than a large number of producers. O In order for a monopoly to exist in this case, the government must have intervened and created it. O The water company must own a scarce resource. True or False: Without government regulation, natural monopolies always earn zero profit in the long run. O True O False
Step by Step Solution
There are 3 Steps involved in it

Get step-by-step solutions from verified subject matter experts