

Question: 2b. Interpret data displayed in tables and graphs (what type of data is shown? Is it quantitative or qualitative? What is the distribution of the
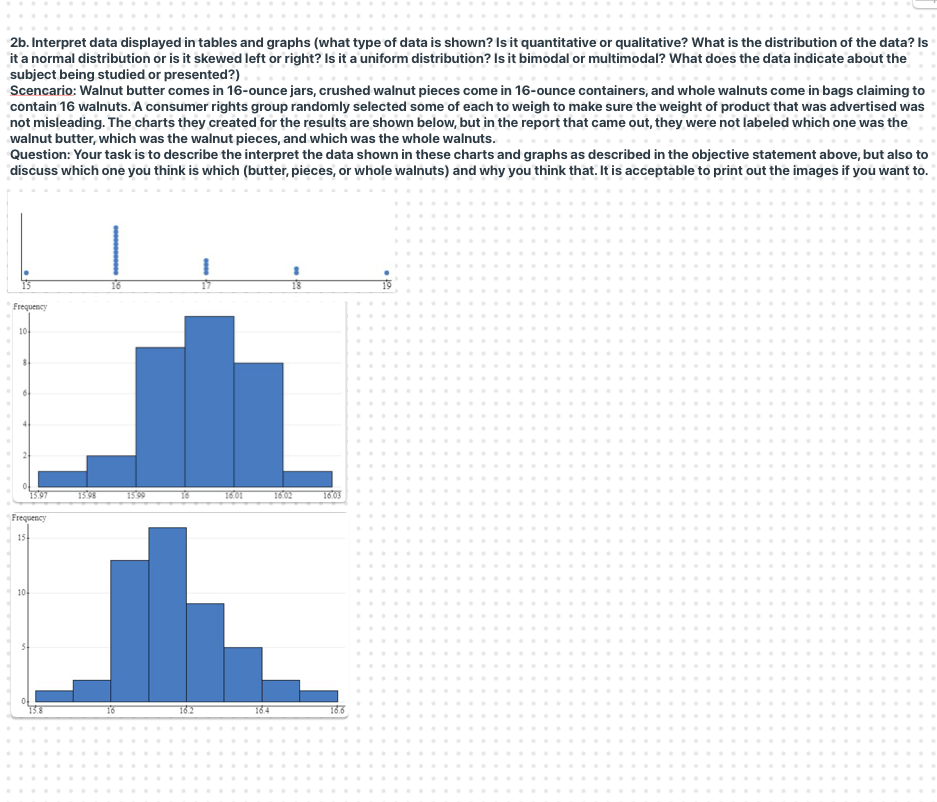
2b. Interpret data displayed in tables and graphs (what type of data is shown? Is it quantitative or qualitative? What is the distribution of the data? s it a normal distribution or is it skewed left or right? Is it a uniform distribution? Is it bimodal or multimodal? What does the data indicate about the subject being studied or presented?) Scencario: Walnut butter comes in 16-ounce jars, crushed walnut pieces come in 16-ounce containers, and whole walnuts come in bags claiming to contain 16 walnuts. A consumer rights group randomly selected some of each to weigh to make sure the weight of product that was advertised was not misleading. The charts they created for the results are shown below, but in the report that came out, they were not labeled which one was the walnut butter, which was the walnut pieces, and which was the whole walnuts. Question: Your task is to describe the interpret the data shown in these charts and graphs as described in the objective statement above, but also to discuss which one you think is which (butter, pieces, or whole walnuts) and why you think that. It is acceptable to print out the images if you want to
Step by Step Solution
There are 3 Steps involved in it

Get step-by-step solutions from verified subject matter experts