

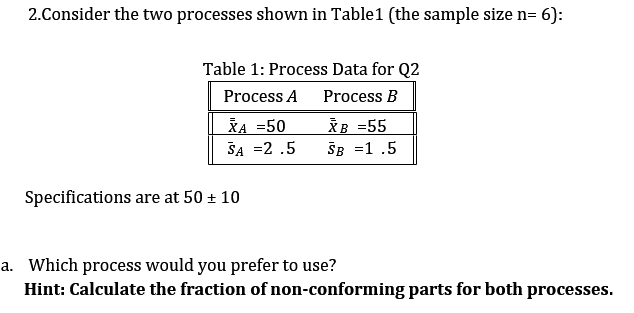
Question: 2.Consider the two processes shown in Table1 (the sample size n=6): Table 1: Process Data for Q2 Process A Process B A =50 B =55
Step by Step Solution
There are 3 Steps involved in it
1 Expert Approved Answer
Step: 1 Unlock

Question Has Been Solved by an Expert!
Get step-by-step solutions from verified subject matter experts
Step: 2 Unlock
Step: 3 Unlock