

Question: 2D Electrons in a Quantum Corral I=0, na1 2 3 5 4 Center of 48 Atom 3 M 3 Ring (.0 LOL) AP/IP N 1
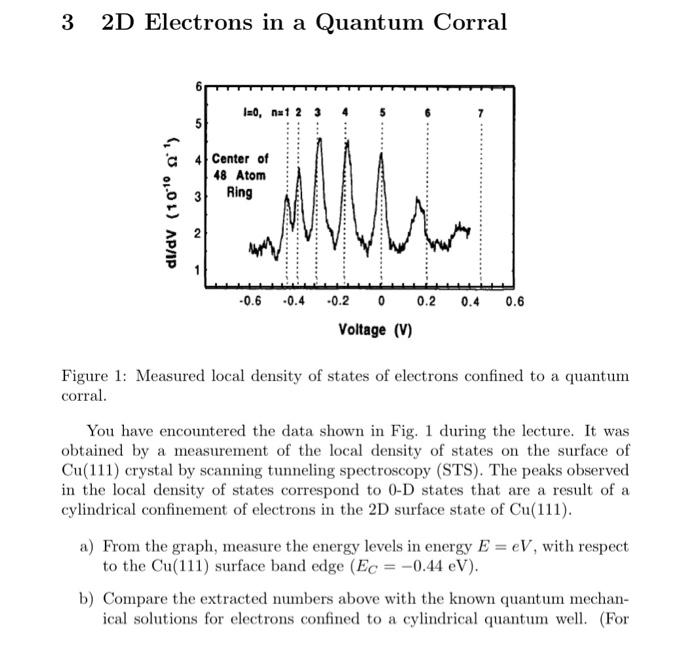
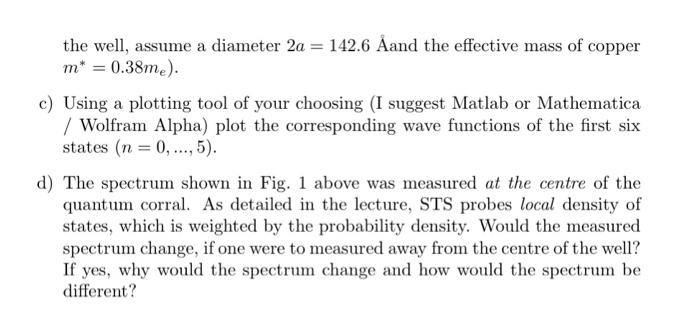
2D Electrons in a Quantum Corral I=0, na1 2 3 5 4 Center of 48 Atom 3 M 3 Ring (.0 LOL) AP/IP N 1 0.4 0.6 -0.6 -0.4 -0.2 0 0.2 Voltage (V) Figure 1: Measured local density of states of electrons confined to a quantum corral. You have encountered the data shown in Fig. 1 during the lecture. It was obtained by a measurement of the local density of states on the surface of Cu(111) crystal by scanning tunneling spectroscopy (STS). The peaks observed in the local density of states correspond to 0-D states that are a result of a cylindrical confinement of electrons in the 2D surface state of Cu(111). a) From the graph, measure the energy levels in energy E = eV, with respect to the Cu(111) surface band edge (Ec = -0.44 eV). b) Compare the extracted numbers above with the known quantum mechan- ical solutions for electrons confined to a cylindrical quantum well. (For the well, assume a diameter 2a = 142.6 and the effective mass of copper m* = 0.38me). c) Using a plotting tool of your choosing (I suggest Matlab or Mathematica / Wolfram Alpha) plot the corresponding wave functions of the first six states (n = 0,...,5). d) The spectrum shown in Fig. 1 above was measured at the centre of the quantum corral. As detailed in the lecture, STS probes local density of states, which is weighted by the probability density. Would the measured spectrum change, if one were to measured away from the centre of the well? If yes, why would the spectrum change and how would the spectrum be different? 2D Electrons in a Quantum Corral I=0, na1 2 3 5 4 Center of 48 Atom 3 M 3 Ring (.0 LOL) AP/IP N 1 0.4 0.6 -0.6 -0.4 -0.2 0 0.2 Voltage (V) Figure 1: Measured local density of states of electrons confined to a quantum corral. You have encountered the data shown in Fig. 1 during the lecture. It was obtained by a measurement of the local density of states on the surface of Cu(111) crystal by scanning tunneling spectroscopy (STS). The peaks observed in the local density of states correspond to 0-D states that are a result of a cylindrical confinement of electrons in the 2D surface state of Cu(111). a) From the graph, measure the energy levels in energy E = eV, with respect to the Cu(111) surface band edge (Ec = -0.44 eV). b) Compare the extracted numbers above with the known quantum mechan- ical solutions for electrons confined to a cylindrical quantum well. (For the well, assume a diameter 2a = 142.6 and the effective mass of copper m* = 0.38me). c) Using a plotting tool of your choosing (I suggest Matlab or Mathematica / Wolfram Alpha) plot the corresponding wave functions of the first six states (n = 0,...,5). d) The spectrum shown in Fig. 1 above was measured at the centre of the quantum corral. As detailed in the lecture, STS probes local density of states, which is weighted by the probability density. Would the measured spectrum change, if one were to measured away from the centre of the well? If yes, why would the spectrum change and how would the spectrum be different
Step by Step Solution
There are 3 Steps involved in it

Get step-by-step solutions from verified subject matter experts