

Question: 2nd part Homework: Section 10.1 Question 6, 10.1.23 HW Score: 85.56%, 7.7 of 9 points Part 3 of 4 Points: 0.2 of 1 Save Listed
2nd part
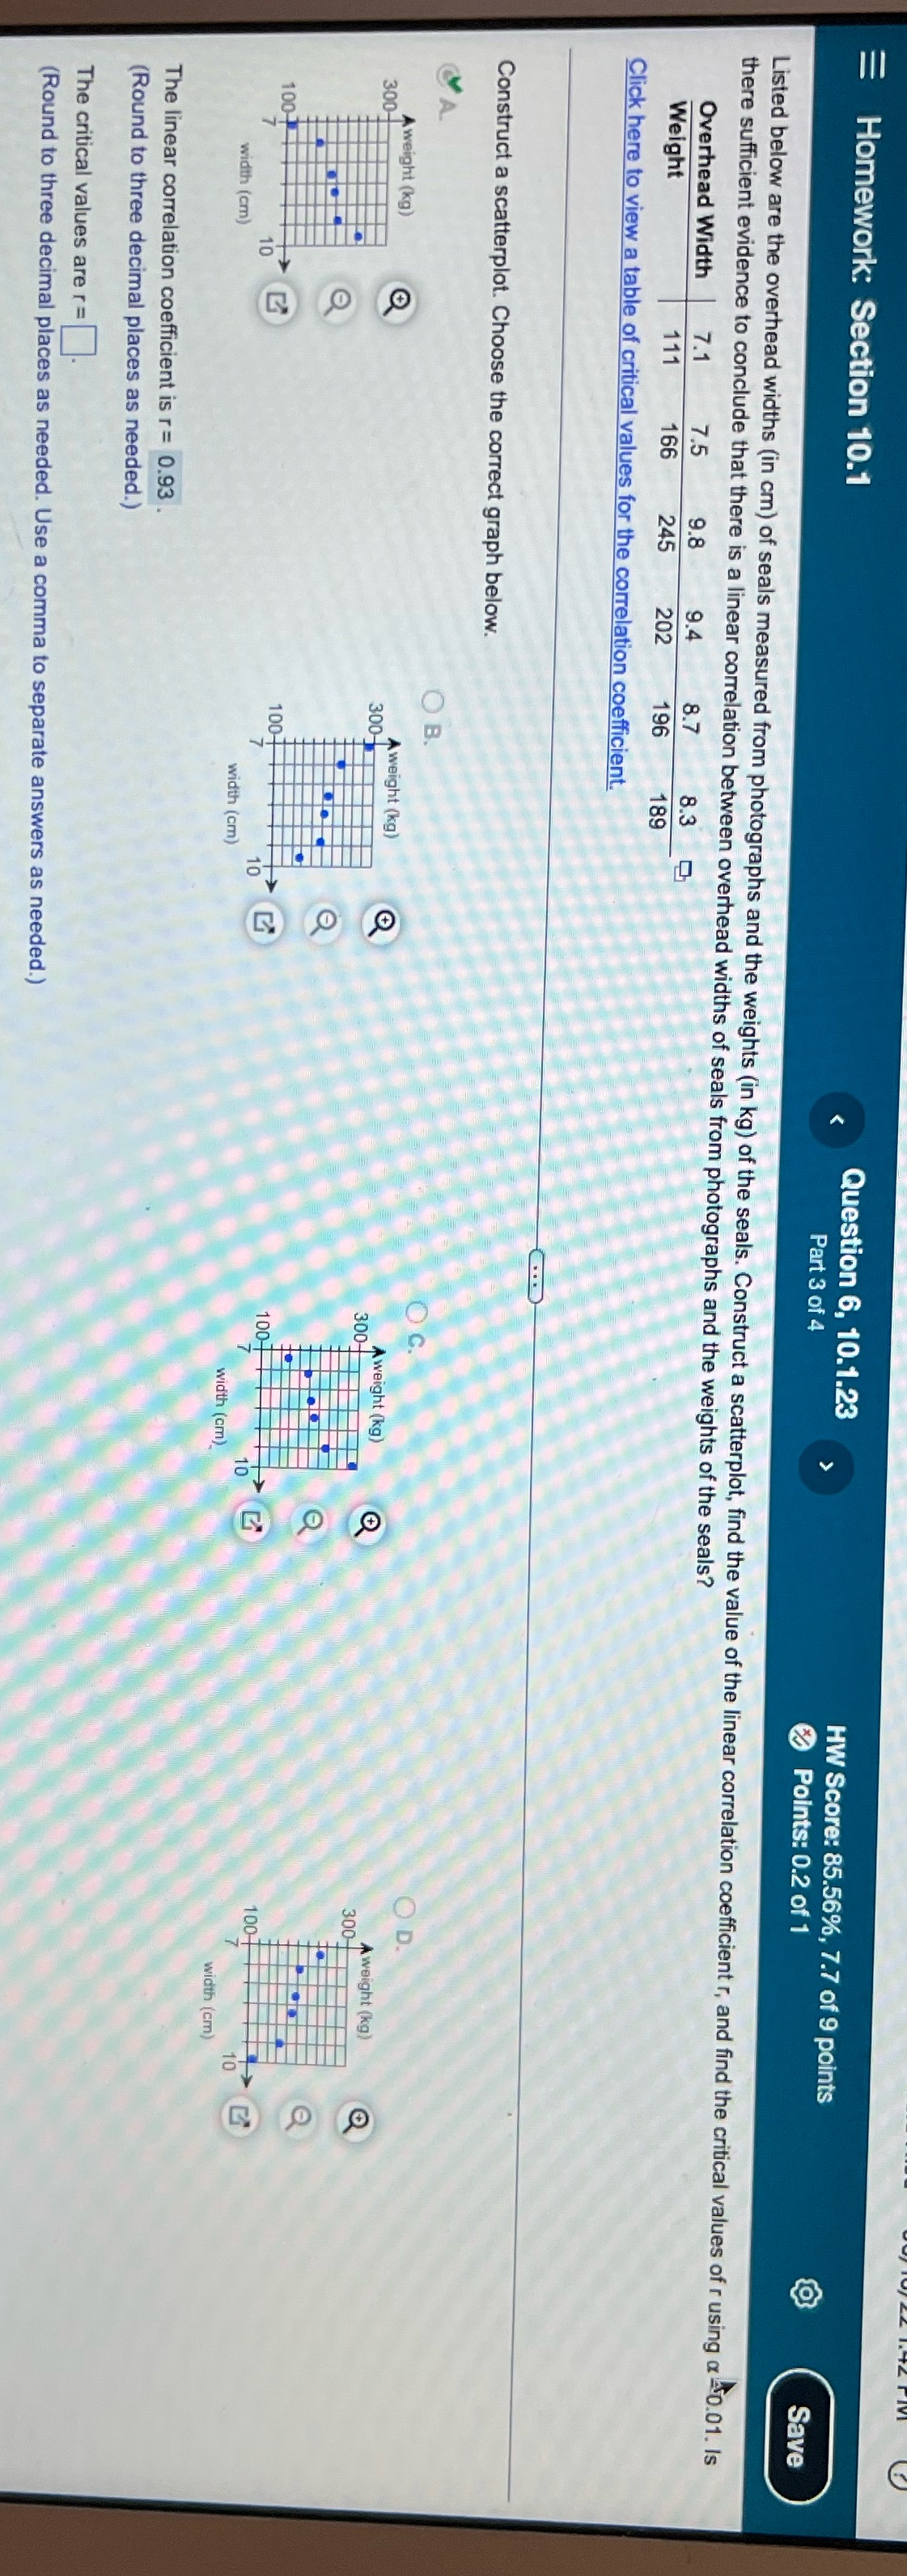
Homework: Section 10.1 Question 6, 10.1.23 HW Score: 85.56%, 7.7 of 9 points Part 3 of 4 Points: 0.2 of 1 Save Listed below are the overhead widths (in cm) of seals measured from photographs and the weights (in kg) of the seals. Construct a scatterplot, find the value of the linear correlation coefficient r, and find the critical values of r using a 40.01. Is there sufficient evidence to conclude that there is a linear correlation between overhead widths of seals from photographs and the weights of the seals? Overhead Width 7.1 7.5 9.8 9.4 8.7 8.3 Weight 111 166 245 202 196 189 Click here to view a table of critical values for the correlation coefficient. Construct a scatterplot. Choose the correct graph below. O B. OC. O D. A weight (kg) A weight (kg) 300- A weight (kg) A weight (kg) 300 300- 300 O 100 100 100 100 10 10 10 10 width (cm) width (cm) width (cm) width (cm) The linear correlation coefficient is r = 0.93. (Round to three decimal places as needed.) The critical values are r= (Round to three decimal places as needed. Use a comma to separate answers as needed.)
Step by Step Solution
There are 3 Steps involved in it

Get step-by-step solutions from verified subject matter experts