

Question: 2nd Shift Auto Unit & mation Primary Units Inven Age Pfmn Size ame Segment Sold tory Revision Date ble cre Trad 999 189 11/21/2010
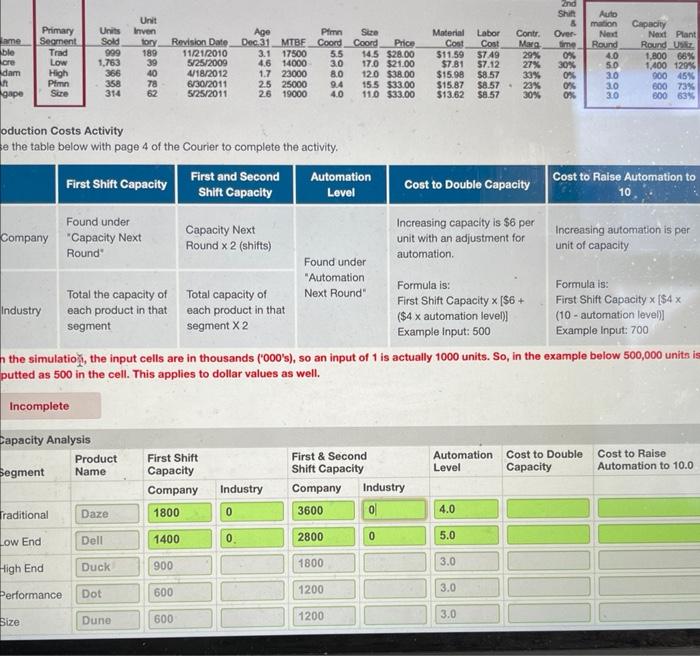
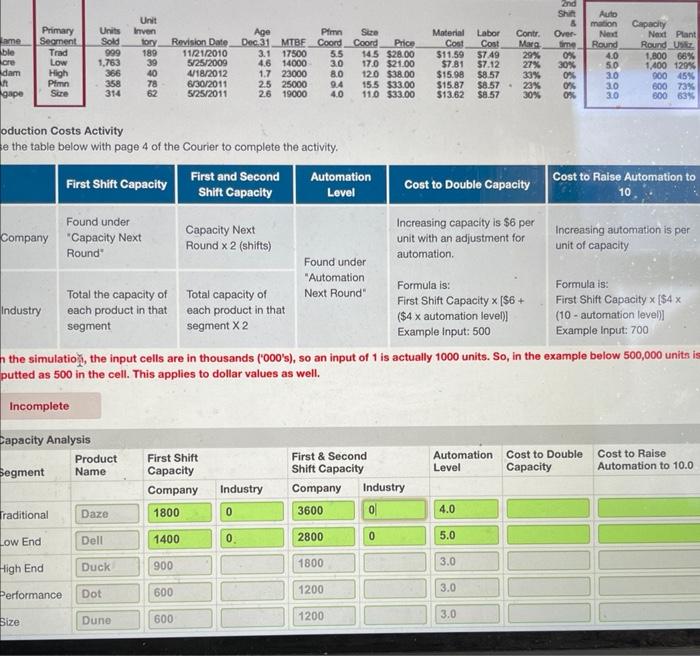
2nd Shift Auto Unit & mation Primary Units Inven Age Pfmn Size ame Segment Sold tory Revision Date ble cre Trad 999 189 11/21/2010 3.1 17500 Dec.31 MTBF Coord Coord. Price 14.5 $28.00 Material Labor Cost Cost Marg time Contr. Over- Next Capacity Next Plant Round Round Usiz 5.5 $11.59 $7.49 29% 0% Low 1,763 39 5/25/2009 4.6 14000 3.0 17.0 $21.00 $7.81 $7.12 27% 30% dam High 366 40 4/18/2012 1.7 23000 8.0 12.0 $38.00 $15.98 $8.57 33% 0% 3.0 Pfmn 358 78 gape Size 314 62 6/30/2011 5/25/2011 2.5 25000 2.6 19000 9.4 4.0 15.5 $33.00 11.0 $33.00 $15.87 $13.62 $8.57- 23% 0% $8.57 30% 0% 00000 15333 4.0 5.0 1,800 66% 1,400 129% 900 45% 3.0 600 73% 3.0 600 63% oduction Costs Activity e the table below with page 4 of the Courier to complete the activity. First and Second First Shift Capacity Shift Capacity Automation Level Cost to Raise Automation to Cost to Double Capacity 10 Found under Company "Capacity Next Round Capacity Next Round x 2 (shifts) Industry Total the capacity of each product in that segment Total capacity of each product in that segment X 2 Found under "Automation Next Round" Increasing capacity is $6 per Increasing automation is per unit with an adjustment for automation. Formula is: First Shift Capacity x [$6 + ($4 x automation level)] Example Input: 500 unit of capacity Formula is: First Shift Capacity x [$4 x (10-automation level)] Example Input: 700 the simulation, the input cells are in thousands ('000's), so an input of 1 is actually 1000 units. So, in the example below 500,000 units is putted as 500 in the cell. This applies to dollar values as well. Incomplete Capacity Analysis Product First Shift First & Second Segment Name Capacity Shift Capacity Automation Level Cost to Double Cost to Raise Capacity Automation to 10.0 Company Industry Company Industry Traditional Daze 1800 0 3600 4.0 Low End: Dell 1400 0 2800 5.0 High End Duck 900 1800 3.0 Performance Dot 600 1200 3.0 Size Dune 600 1200 3.0
Step by Step Solution
There are 3 Steps involved in it

Get step-by-step solutions from verified subject matter experts