

Question: 2.)Using at least 10 data elements of your choice create two types of charts in an Excel spreadsheet. 3.)Calculate the LOS for the following data
2.)Using at least 10 data elements of your choice create two types of charts in an Excel spreadsheet.
3.)Calculate the LOS for the following data and enter it for each set of dates in the column indicated. Assume that the patient count occurs at noon each day. round up if necessary.
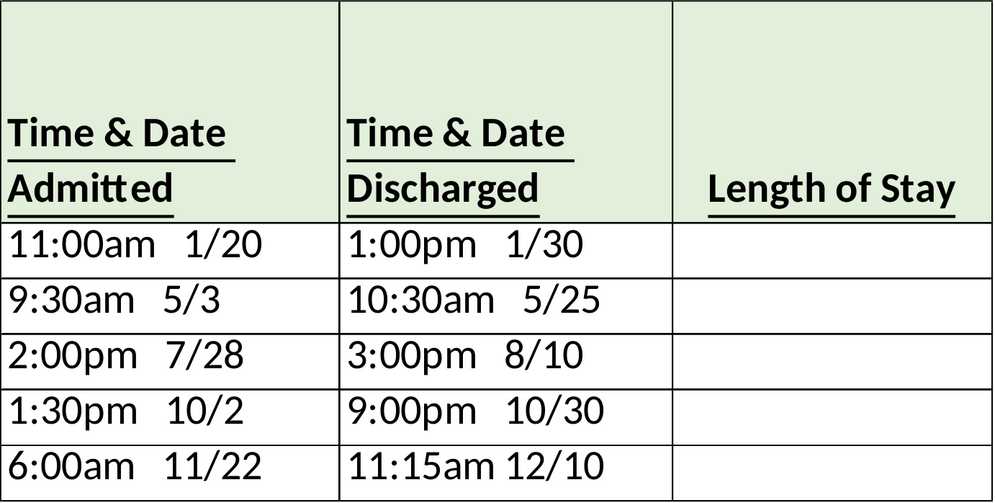


Time & Date Time & Date Admitted Discharged Length of Stay 11:00am 1/20 1:00pm 1/30 9:30am 5/3 10:30am 5/25 2:00pm 7/28 1:30pm 10/2 9:00pm 10/30 6:00am 11/22 11:15am 12/10 Clinical Services Admission Date | 9 Medicine 8/1/2019l Surgery 8/ 20/2019 Obstetrics 8/25/2019 Cardiac 8/15/2019 Intensive Care 8/1/2019 Medicine 8/29/2019 Surgery 8/ 20/ 2019 Obstetrics 8/ 26/ 2019 \f
Step by Step Solution
There are 3 Steps involved in it

Get step-by-step solutions from verified subject matter experts