

Question: ( 3 0 P ) In the IE 0 7 2 3 simulation Modelling course, assume that your team modeled a restaurant and observed the
P In the IE simulation Modelling course, assume that your team modeled
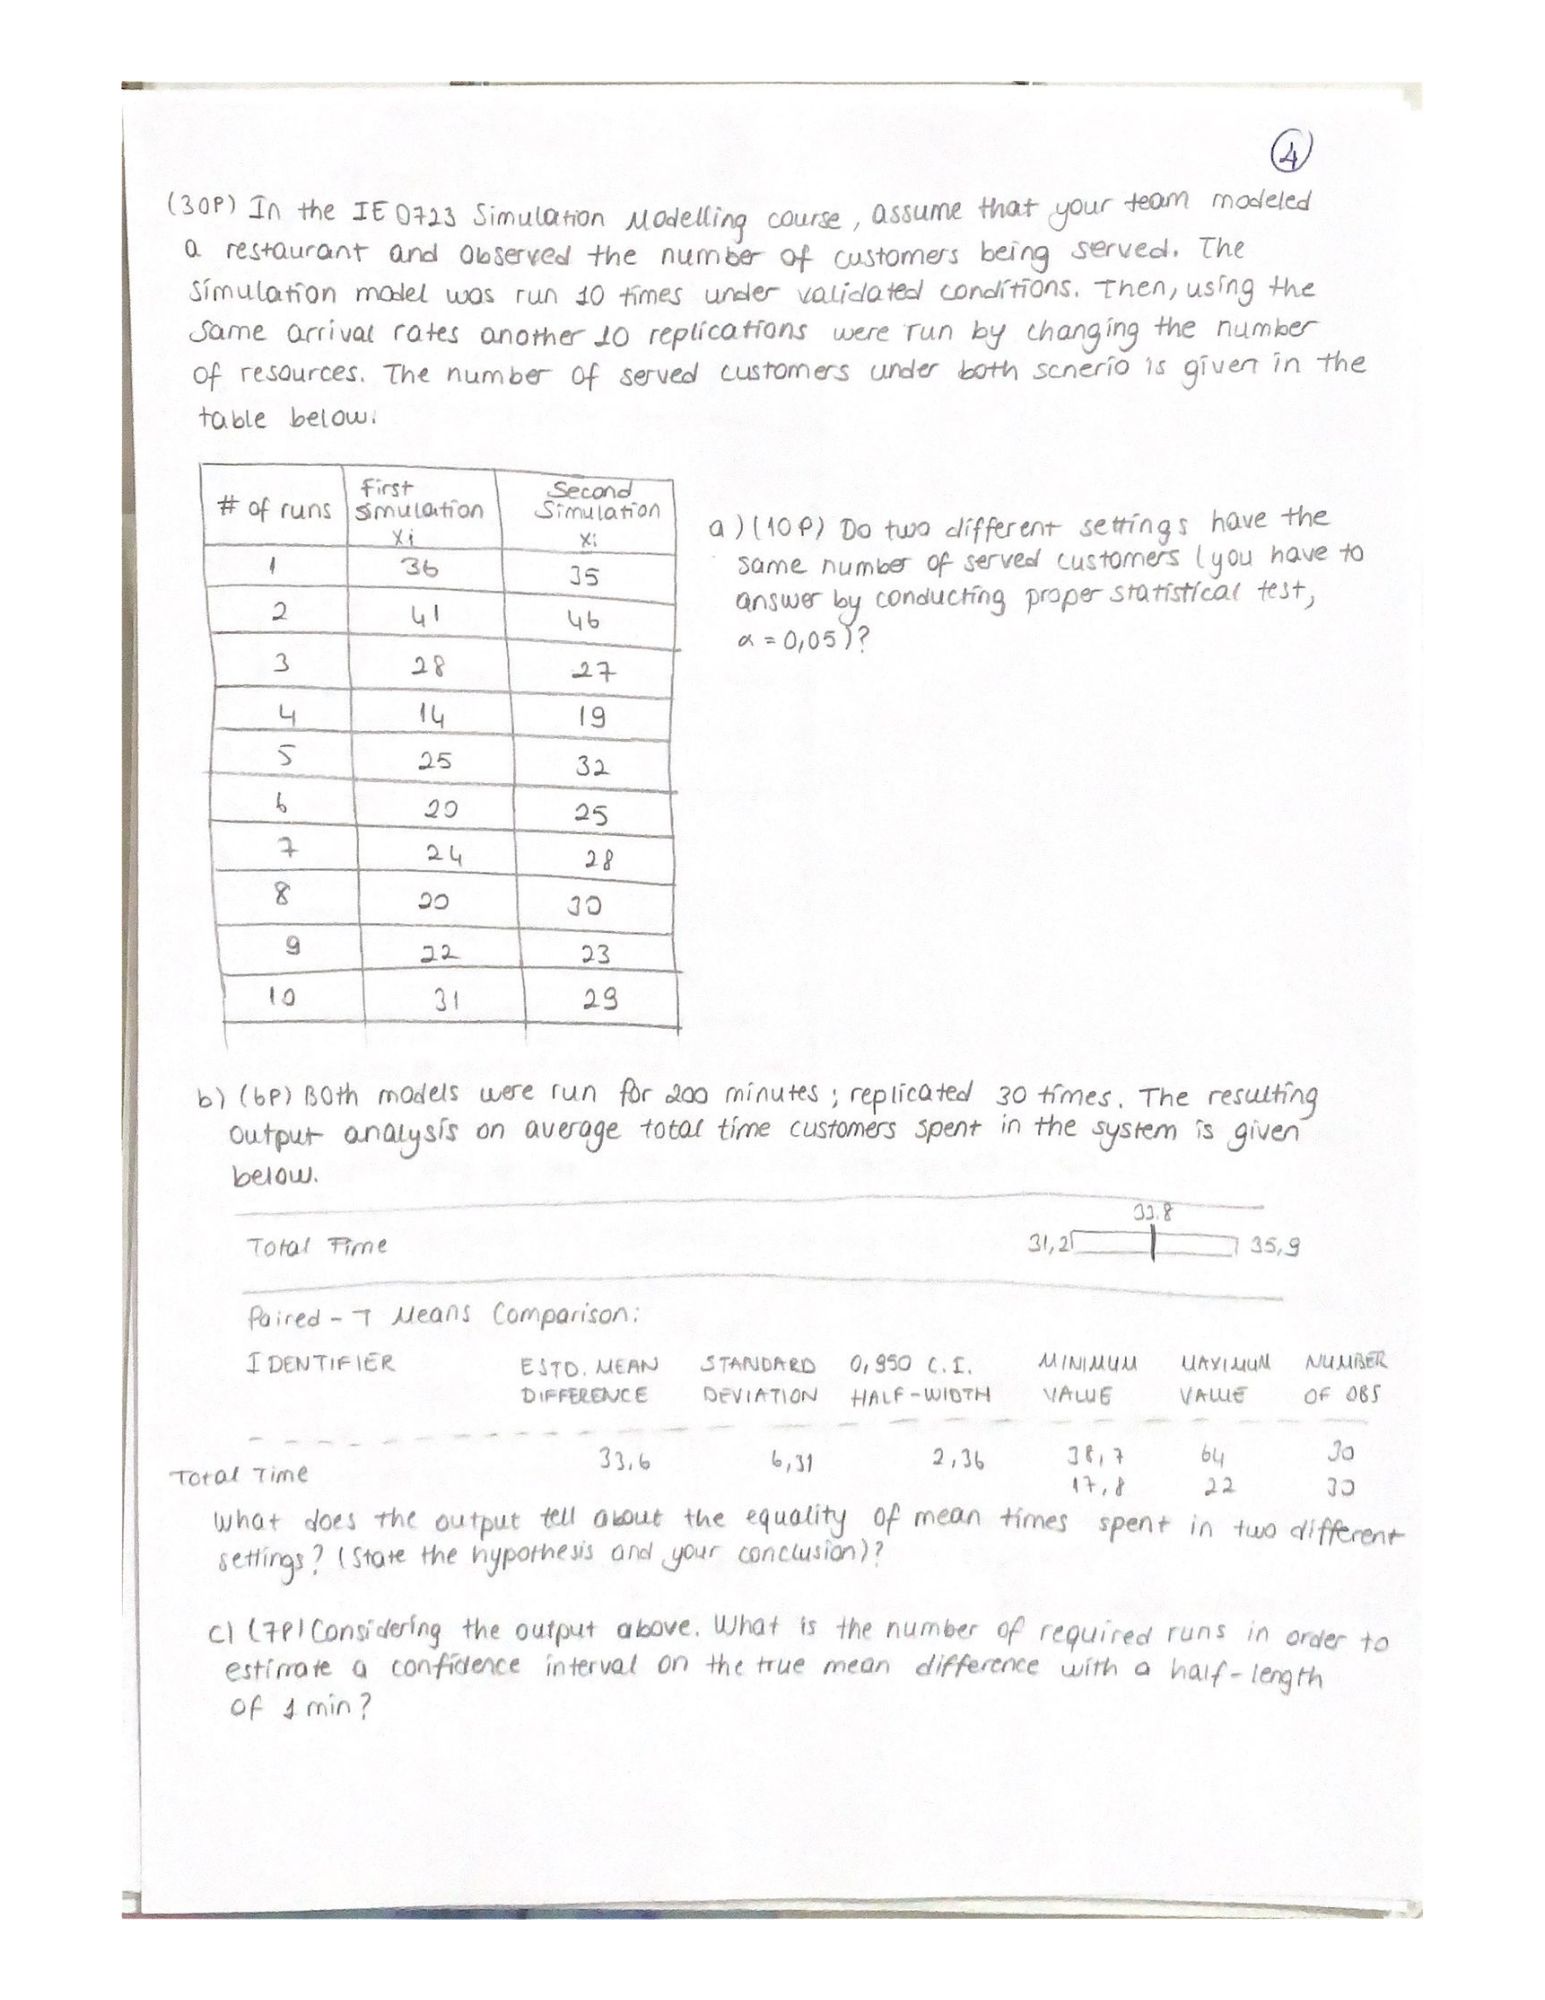
a restaurant and observed the number of customers being served. The
simulation model was run times under validated conditions. Then, using the
Same arrival rates another replications were run by changing the number
of resources. The number of served customers under both scnerio is given in the
table below.
aP Do two different settings have the
same number of served customers you have to
answer by conducting proper statistical test,
bp Both models were run for minutes; replicated times. The resulting
output analysis on average total time customers spent in the system is given
below.
Total Fime
Paired Means Comparison:
IDENTIFIER
ESTD, MEAN
STANDARD CI.
UAYIMUN
NUMER
Difference
DEVIATION HALFWIDTH
VALUE
value
of
Total Time
What does the output tell about the equality of mean times spent in two different
settings? state the hypothesis and your conclusion
C Considering the output above. What is the number of required runs in order to
estirrate a confidence interval on the true mean difference with a halflength
of min
Step by Step Solution
There are 3 Steps involved in it
1 Expert Approved Answer
Step: 1 Unlock

Question Has Been Solved by an Expert!
Get step-by-step solutions from verified subject matter experts
Step: 2 Unlock
Step: 3 Unlock