

Question: ( 3 0 p t ) Using the test data presented in the table for random concentrated load and random umiformly distributed load acting on
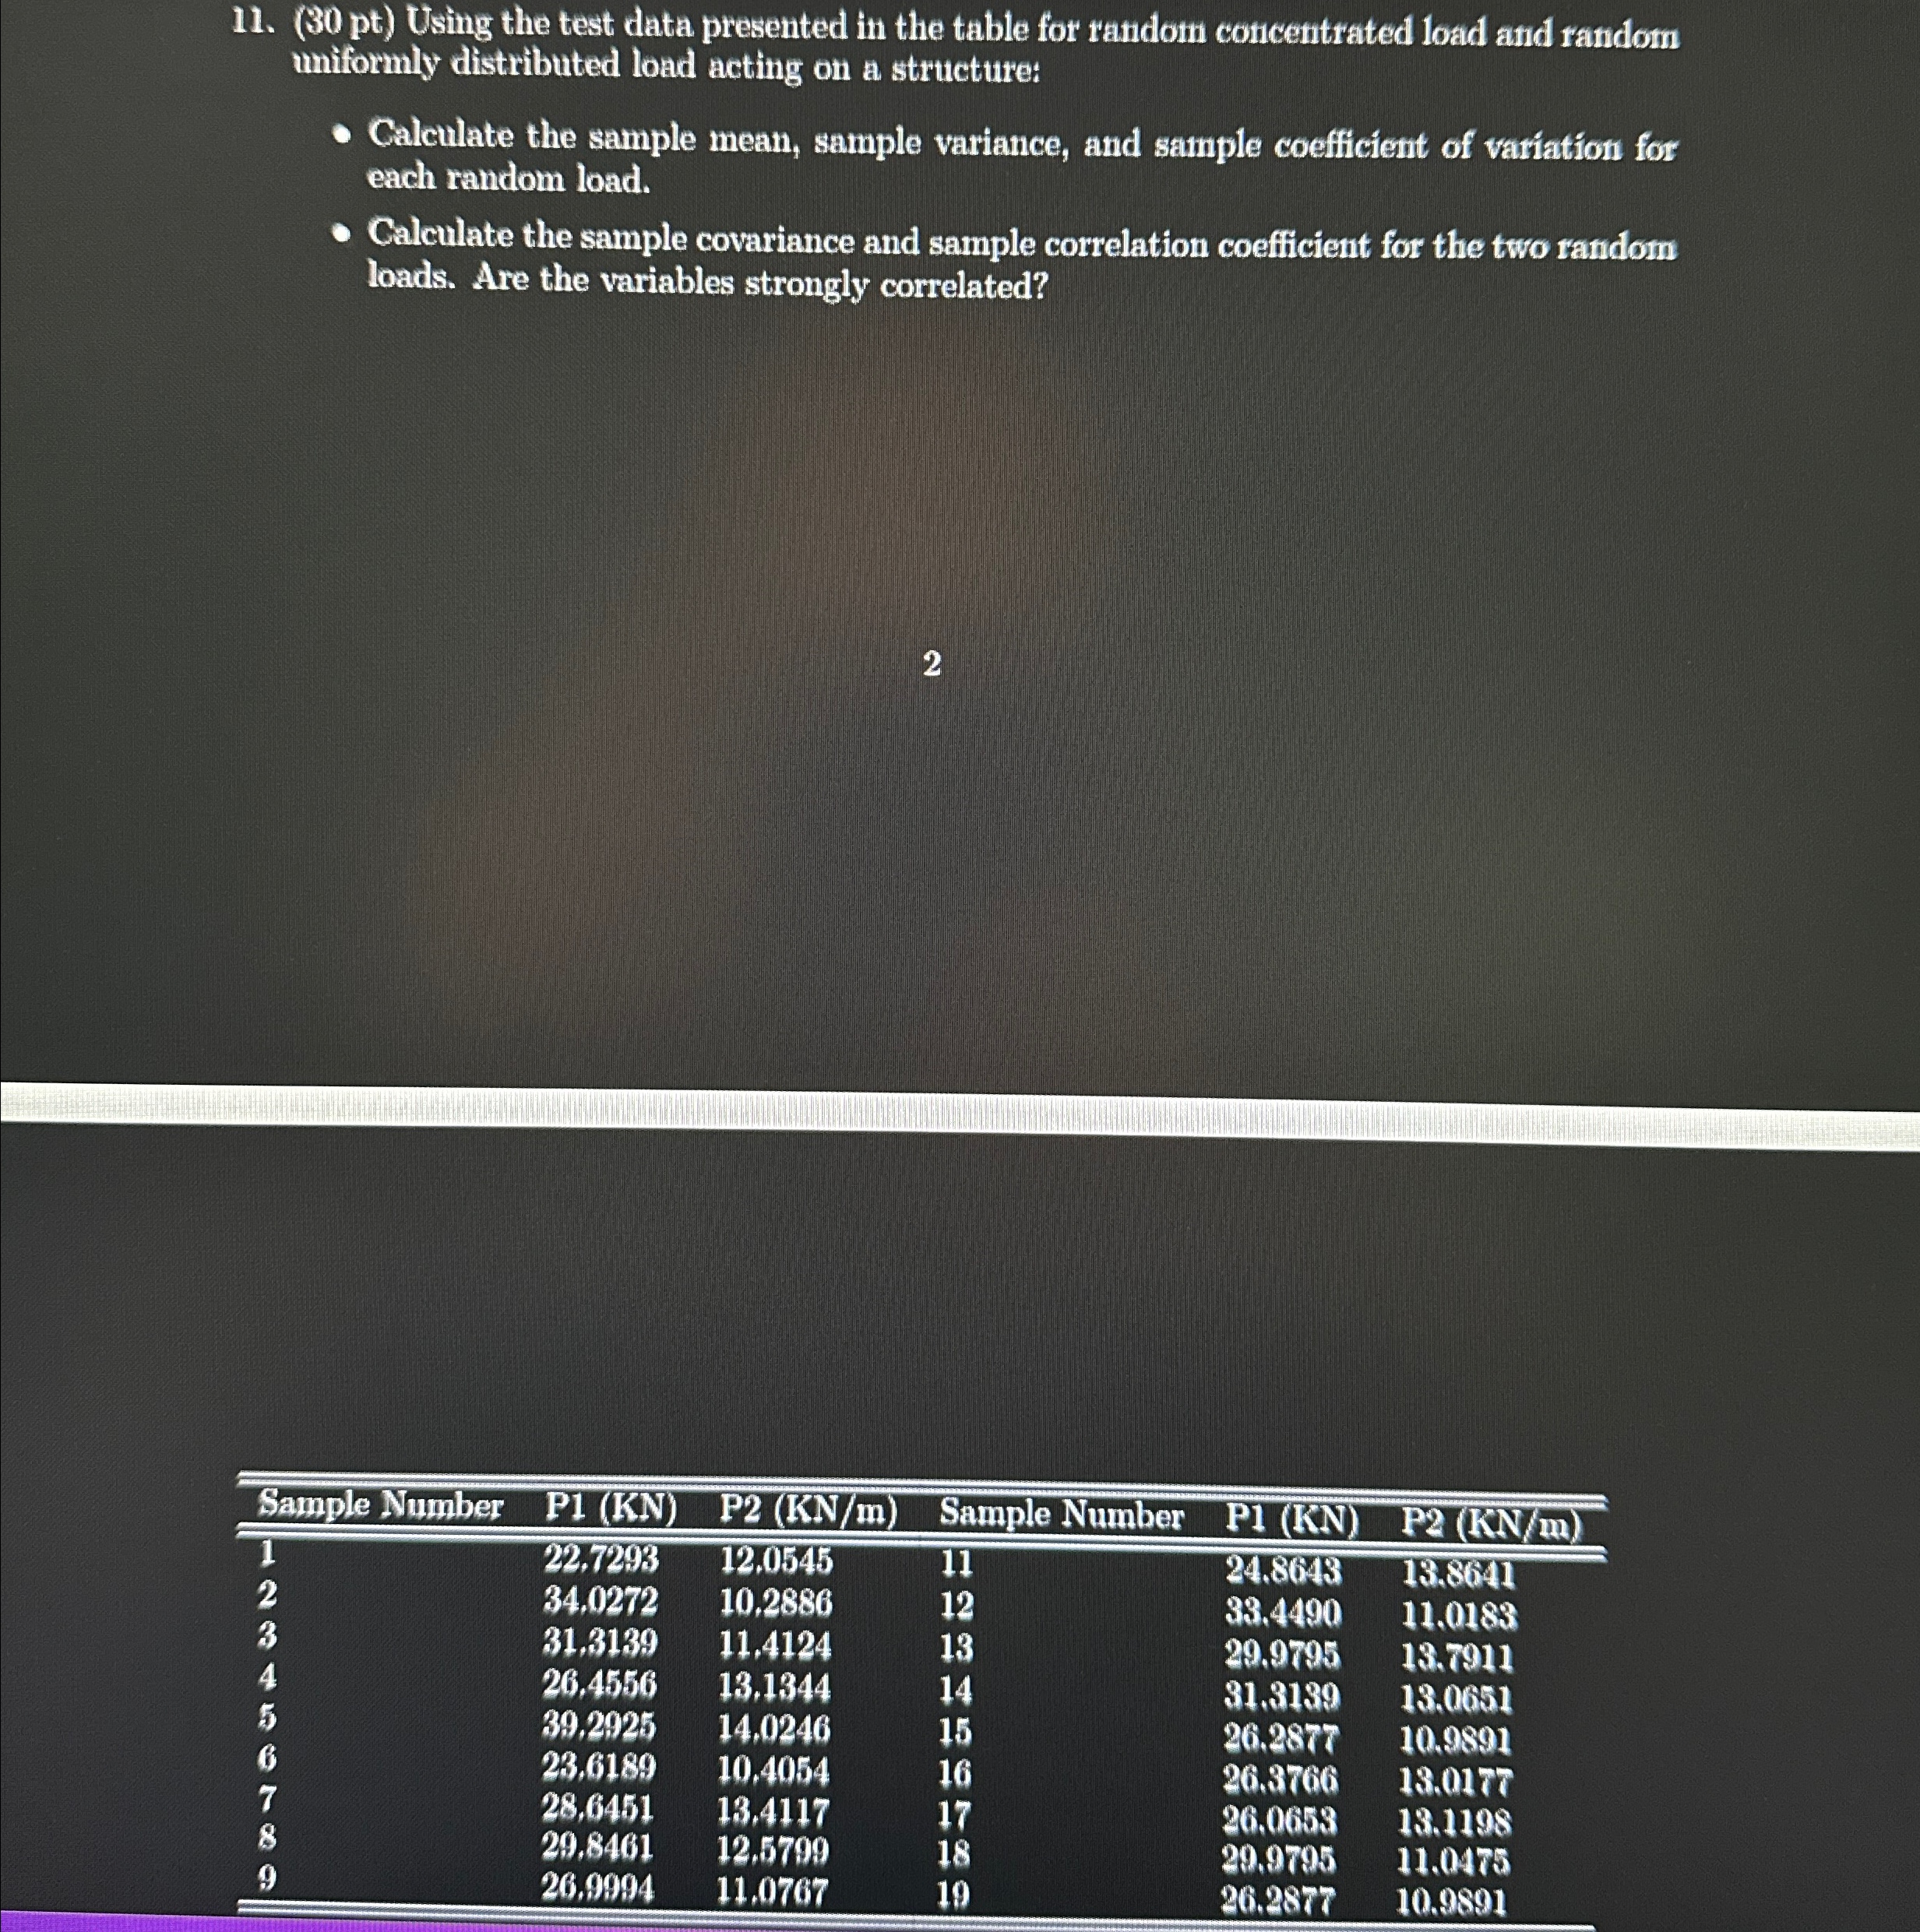
Using the test data presented in the table for random concentrated load and random umiformly distributed load acting on a structure:
Calculate the sample mean, sample variance, and sample coefficient of variation for each random load.
Calculate the sample covariance and sample correlation coefficient for the two random loads. Are the variables strongly correlated?
tableSample Number,PKNPKNmSample Number,PKNPKNm
Step by Step Solution
There are 3 Steps involved in it
1 Expert Approved Answer
Step: 1 Unlock

Question Has Been Solved by an Expert!
Get step-by-step solutions from verified subject matter experts
Step: 2 Unlock
Step: 3 Unlock