

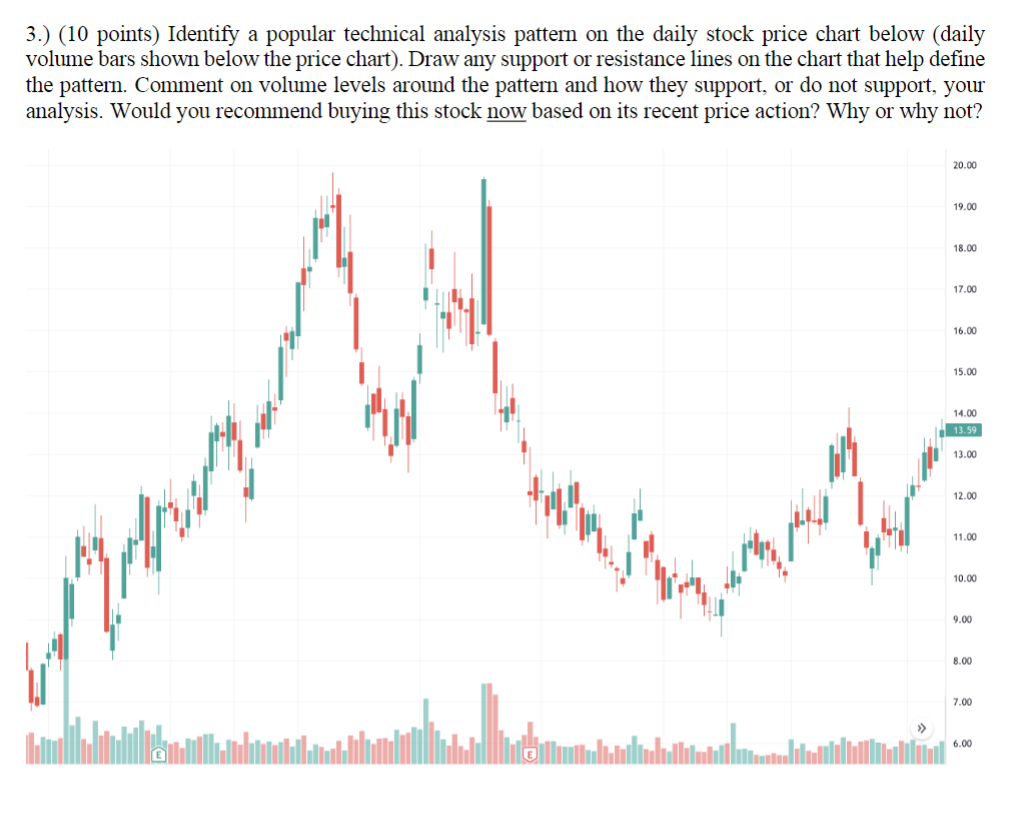
Question: 3 . ) ( 1 0 points ) Identify a popular technical analysis pattern on the daily stock price chart below ( daily volume bars
points Identify a popular technical analysis pattern on the daily stock price chart below daily
volume bars shown below the price chart Draw any support or resistance lines on the chart that help define
the pattern. Comment on volume levels around the pattern and how they support, or do not support, your
analysis. Would you recommend buying this stock now based on its recent price action? Why or why not?
Step by Step Solution
There are 3 Steps involved in it
1 Expert Approved Answer
Step: 1 Unlock

Question Has Been Solved by an Expert!
Get step-by-step solutions from verified subject matter experts
Step: 2 Unlock
Step: 3 Unlock