

Question: 3. (10pts) The scatterplot shows the relationship between the a household's annual income (in thousands of dollars) and its annual energy consumption (in GigaJoules) Simple
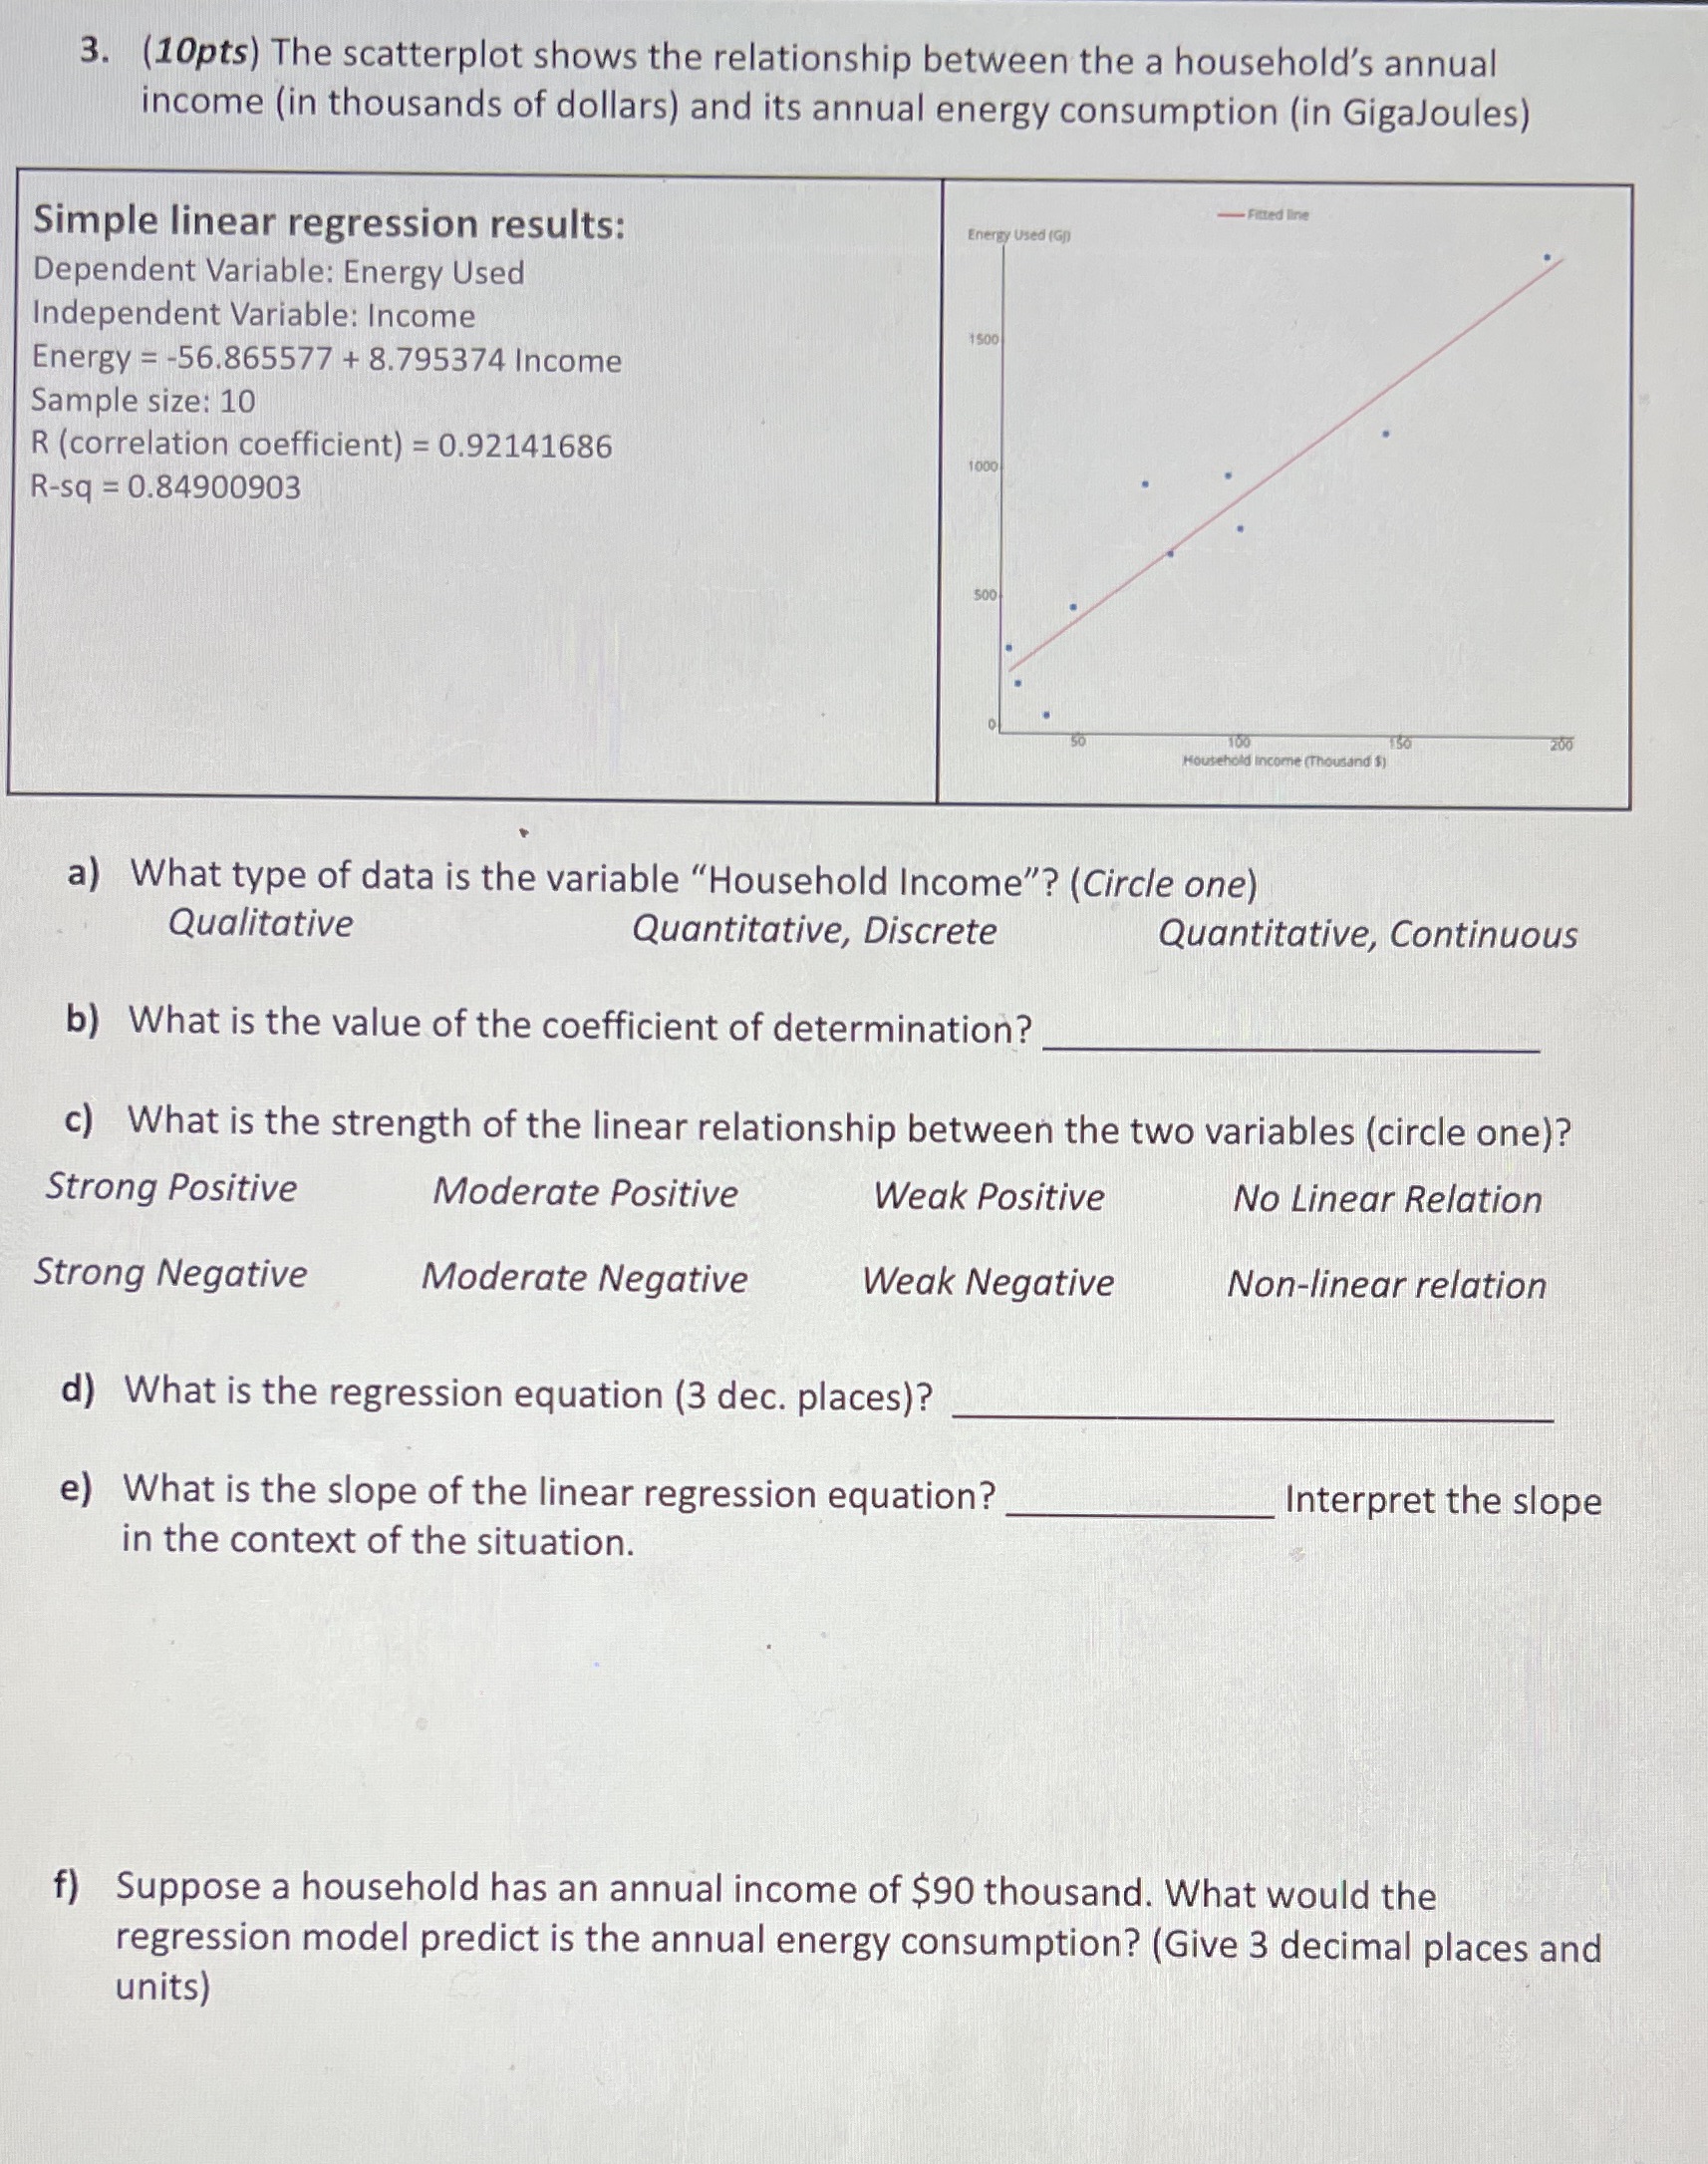
3. (10pts) The scatterplot shows the relationship between the a household's annual income (in thousands of dollars) and its annual energy consumption (in GigaJoules) Simple linear regression results: - Fitted line Energy Used (GD) Dependent Variable: Energy Used Independent Variable: Income 1500 Energy = -56.865577 + 8.795374 Income Sample size: 10 R (correlation coefficient) = 0.92141686 1000 R-sq = 0.84900903 500 ehold income (Thousand $) 150 a) What type of data is the variable "Household Income"? (Circle one) Qualitative Quantitative, Discrete Quantitative, Continuous b) What is the value of the coefficient of determination? c) What is the strength of the linear relationship between the two variables (circle one)? Strong Positive Moderate Positive Weak Positive No Linear Relation Strong Negative Moderate Negative Weak Negative Non-linear relation d) What is the regression equation (3 dec. places)? e) What is the slope of the linear regression equation? Interpret the slope in the context of the situation. f) Suppose a household has an annual income of $90 thousand. What would the regression model predict is the annual energy consumption? (Give 3 decimal places and units)
Step by Step Solution
There are 3 Steps involved in it

Get step-by-step solutions from verified subject matter experts