

Question: 3 - 2 7 Based on the ( X ) and ( Y ) data below, complete the table below using
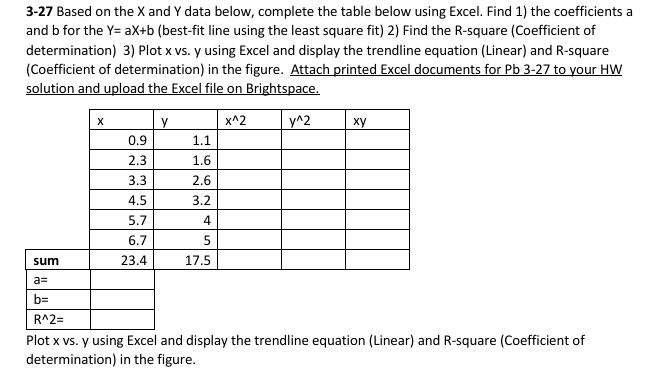
Based on the X and Y data below, complete the table below using Excel. Find the coefficients a and b for the mathrmYmathrmaXmathrmbbestfit line using the least square fit Find the R square Coefficient of determination Plot x vs y using Excel and display the trendline equation Linear and Rsquare Coefficient of determination in the figure. Attach printed Excel documents for mathrmPb to your HW solution and upload the Excel file on Brightspace.
Plot x vs y using Excel and display the trendline equation Linear and Rsquare Coefficient of determination in the figure.
Step by Step Solution
There are 3 Steps involved in it
1 Expert Approved Answer
Step: 1 Unlock

Question Has Been Solved by an Expert!
Get step-by-step solutions from verified subject matter experts
Step: 2 Unlock
Step: 3 Unlock