

Question: 3) (20%) Using the sales data from question 1, where the number of months (1-12) is the independent variable and the sales figures are the
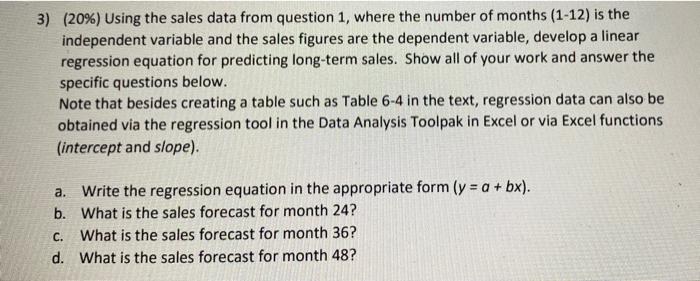
3) (20%) Using the sales data from question 1, where the number of months (1-12) is the independent variable and the sales figures are the dependent variable, develop a linear regression equation for predicting long-term sales. Show all of your work and answer the specific questions below. Note that besides creating a table such as Table 6-4 in the text, regression data can also be obtained via the regression tool in the Data Analysis Toolpak in Excel or via Excel functions (intercept and slope). a. Write the regression equation in the appropriate form (y = a + bx). b. What is the sales forecast for month 24? What is the sales forecast for month 36? d. What is the sales forecast for month 48? C. 3) (20%) Using the sales data from question 1, where the number of months (1-12) is the independent variable and the sales figures are the dependent variable, develop a linear regression equation for predicting long-term sales. Show all of your work and answer the specific questions below. Note that besides creating a table such as Table 6-4 in the text, regression data can also be obtained via the regression tool in the Data Analysis Toolpak in Excel or via Excel functions (intercept and slope). a. Write the regression equation in the appropriate form (y = a + bx). b. What is the sales forecast for month 24? What is the sales forecast for month 36? d. What is the sales forecast for month 48? C
Step by Step Solution
There are 3 Steps involved in it

Get step-by-step solutions from verified subject matter experts