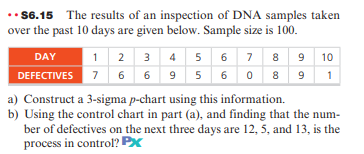
Question: 3 4 8 6 5 1 86.15 The results of an inspection of DNA samples taken over the past 10 days are given below. Sample

3 4 8 6 5 1 86.15 The results of an inspection of3 4 8 6 5 1 86.15 The results of an inspection of

3 4 8 6 5 1 86.15 The results of an inspection of DNA samples taken over the past 10 days are given below. Sample size is 100. DAY 1 2 3 4 5 6 7 8 9 10 6 7 DEFECTIVES 7 6 6 9 5 6 0 8 9 1 a) Construct a 3-sigma p-chart using this information. b) Using the control chart in part (a), and finding that the num- ber of defectives on the next three days are 12, 5, and 13, is the process in control? PX 12/9/21 Quality control/p-chart Enter the sample size then enter the center 1 Number of samples Sample size Data Results Ctr. line Sample 1 Percentage defect Std dev of p-bar #DIV/0! z value 3 Upper Control Lin #DIV/0! Center Line Lower Control Lin #DIV/0! 0

Step by Step Solution

There are 3 Steps involved in it

1 Expert Approved Answer
Step: 1 Unlock blur-text-image
Question Has Been Solved by an Expert!

Get step-by-step solutions from verified subject matter experts

Step: 2 Unlock
Step: 3 Unlock

Students Have Also Explored These Related General Management Questions!