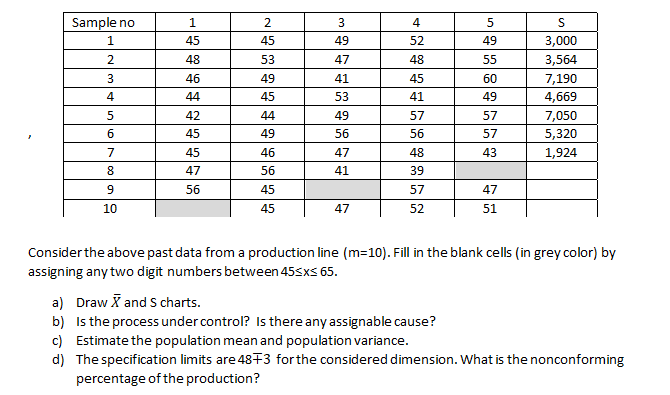
Question: 3 4 Sample no 1 2 1 45 49 5 49 55 48 47 3 46 2 45 53 49 45 44 49 41 53

3 4 Sample no 1 2 1 45 49 5 49 55 48 47 3 46 2 45

3 4 Sample no 1 2 1 45 49 5 49 55 48 47 3 46 2 45 53 49 45 44 49 41 53 4 S 3,000 3,564 7,190 4,669 7,050 5,320 1,924 52 48 45 41 57 56 48 39 60 49 57 57 44 42 45 45 47 5 6 49 56 46 43 7 8 47 41 56 9 56 45 57 47 10 45 47 52 51 Consider the above past data from a production line (m=10). Fill in the blank cells (in grey color) by assigning any two digit numbers between 45sxs 65. a) Draw X and S charts. b) Is the process under control? Is there any assignable cause? c) Estimate the population mean and population variance. d) The specification limits are 4873 for the considered dimension. What is the nonconforming percentage of the production

Step by Step Solution

There are 3 Steps involved in it

1 Expert Approved Answer
Step: 1 Unlock blur-text-image
Question Has Been Solved by an Expert!

Get step-by-step solutions from verified subject matter experts

Step: 2 Unlock
Step: 3 Unlock

Students Have Also Explored These Related General Management Questions!