

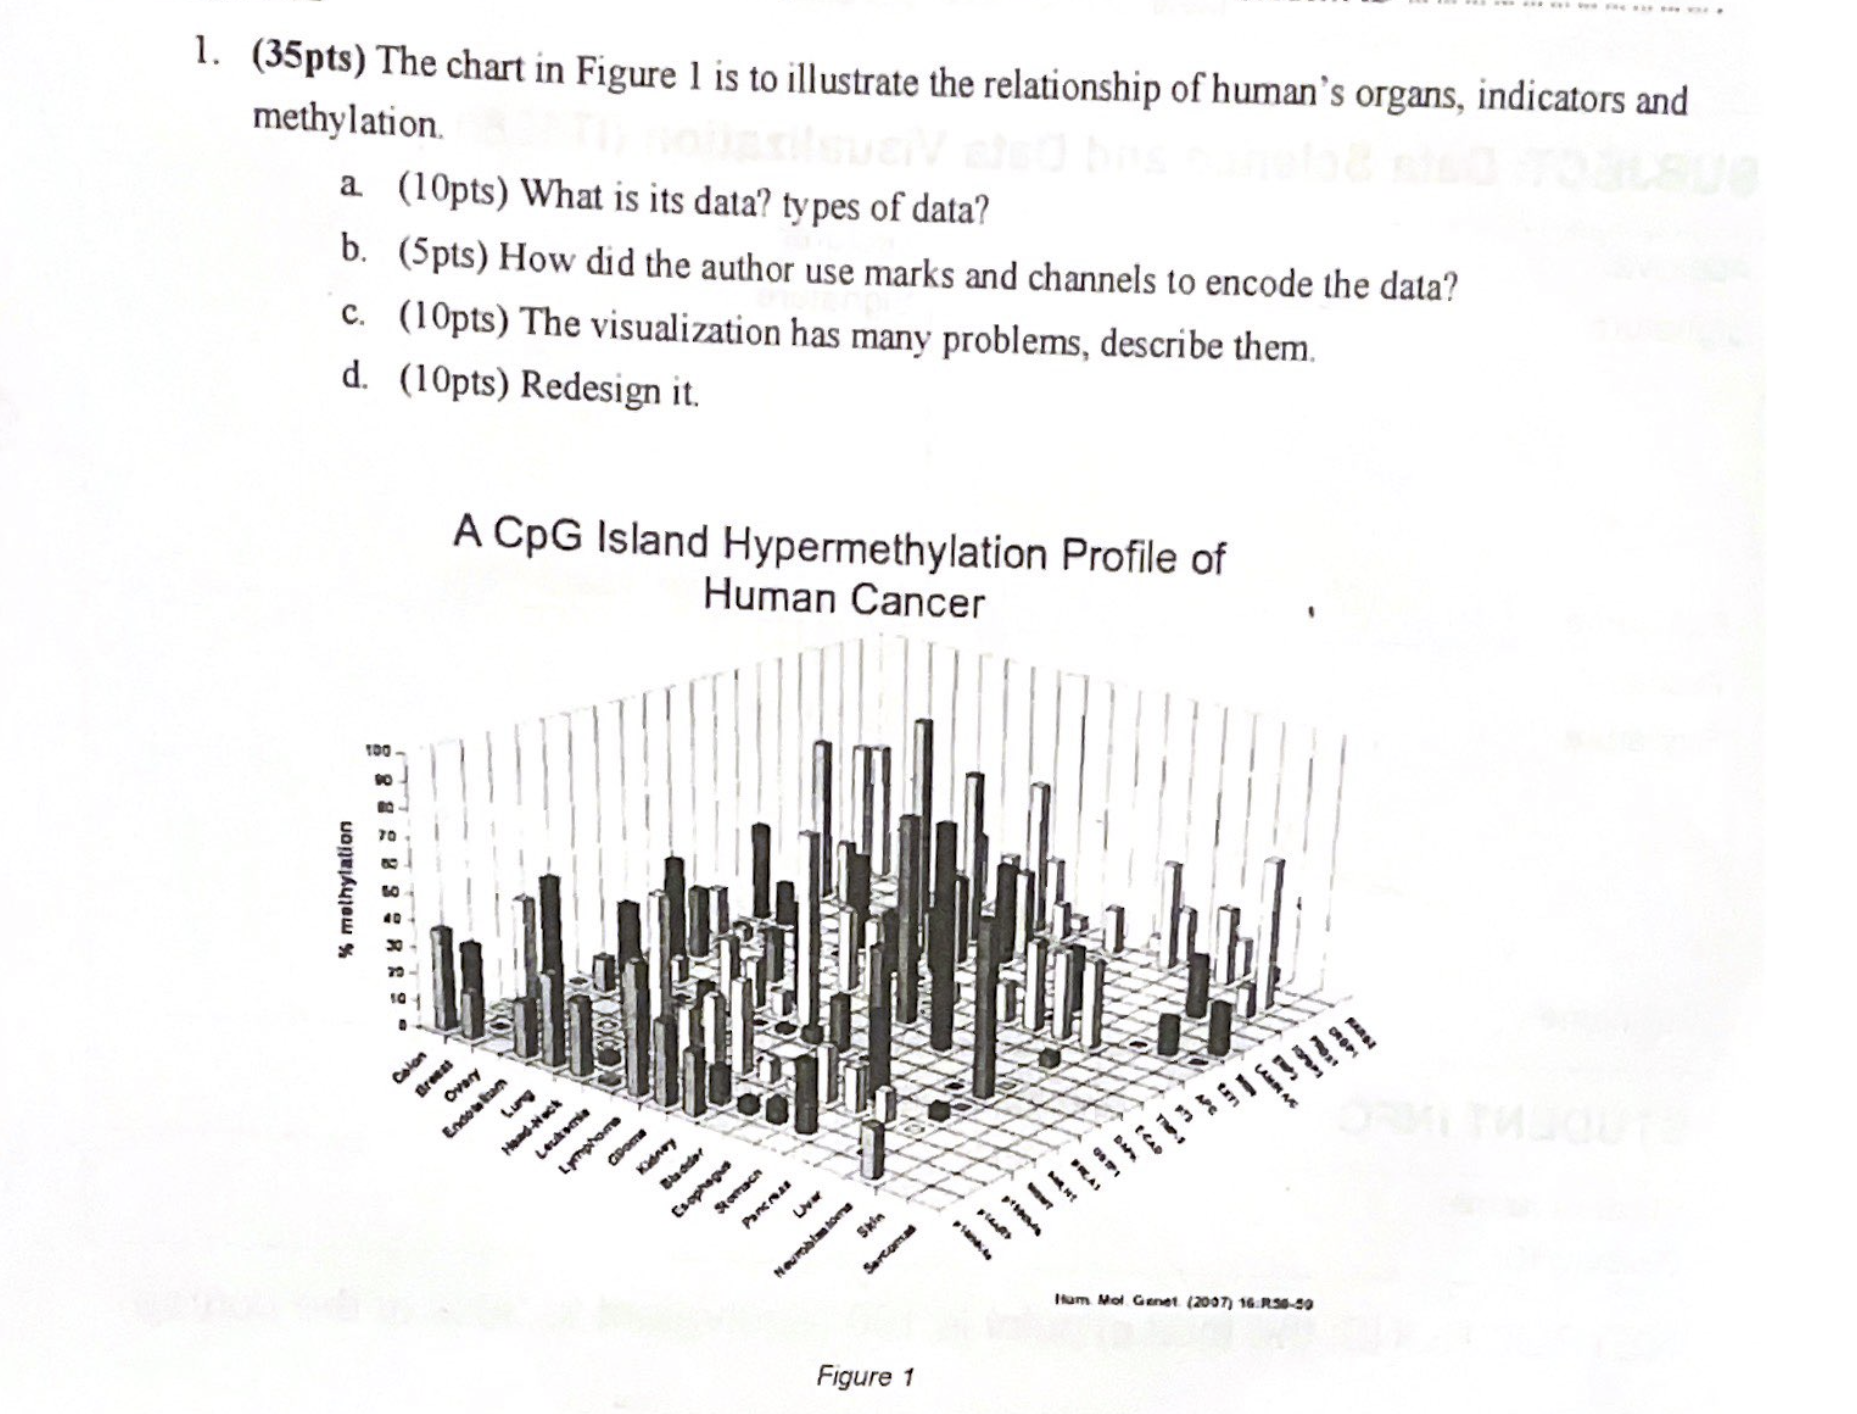
Question: ( 3 5 pts ) The chart in Figure 1 is to illustrate the relationship of human's organs, indicators and methylation. a . ( 1
pts The chart in Figure is to illustrate the relationship of human's organs, indicators and methylation.
apts What is its data? types of data?
bpts How did the author use marks and channels to encode the data?
cpts The visualization has many problems, describe them.
dpts Redesign it
A CpG Island Hypermethylation Profile of Human Canror
Figure
Step by Step Solution
There are 3 Steps involved in it
1 Expert Approved Answer
Step: 1 Unlock

Question Has Been Solved by an Expert!
Get step-by-step solutions from verified subject matter experts
Step: 2 Unlock
Step: 3 Unlock