

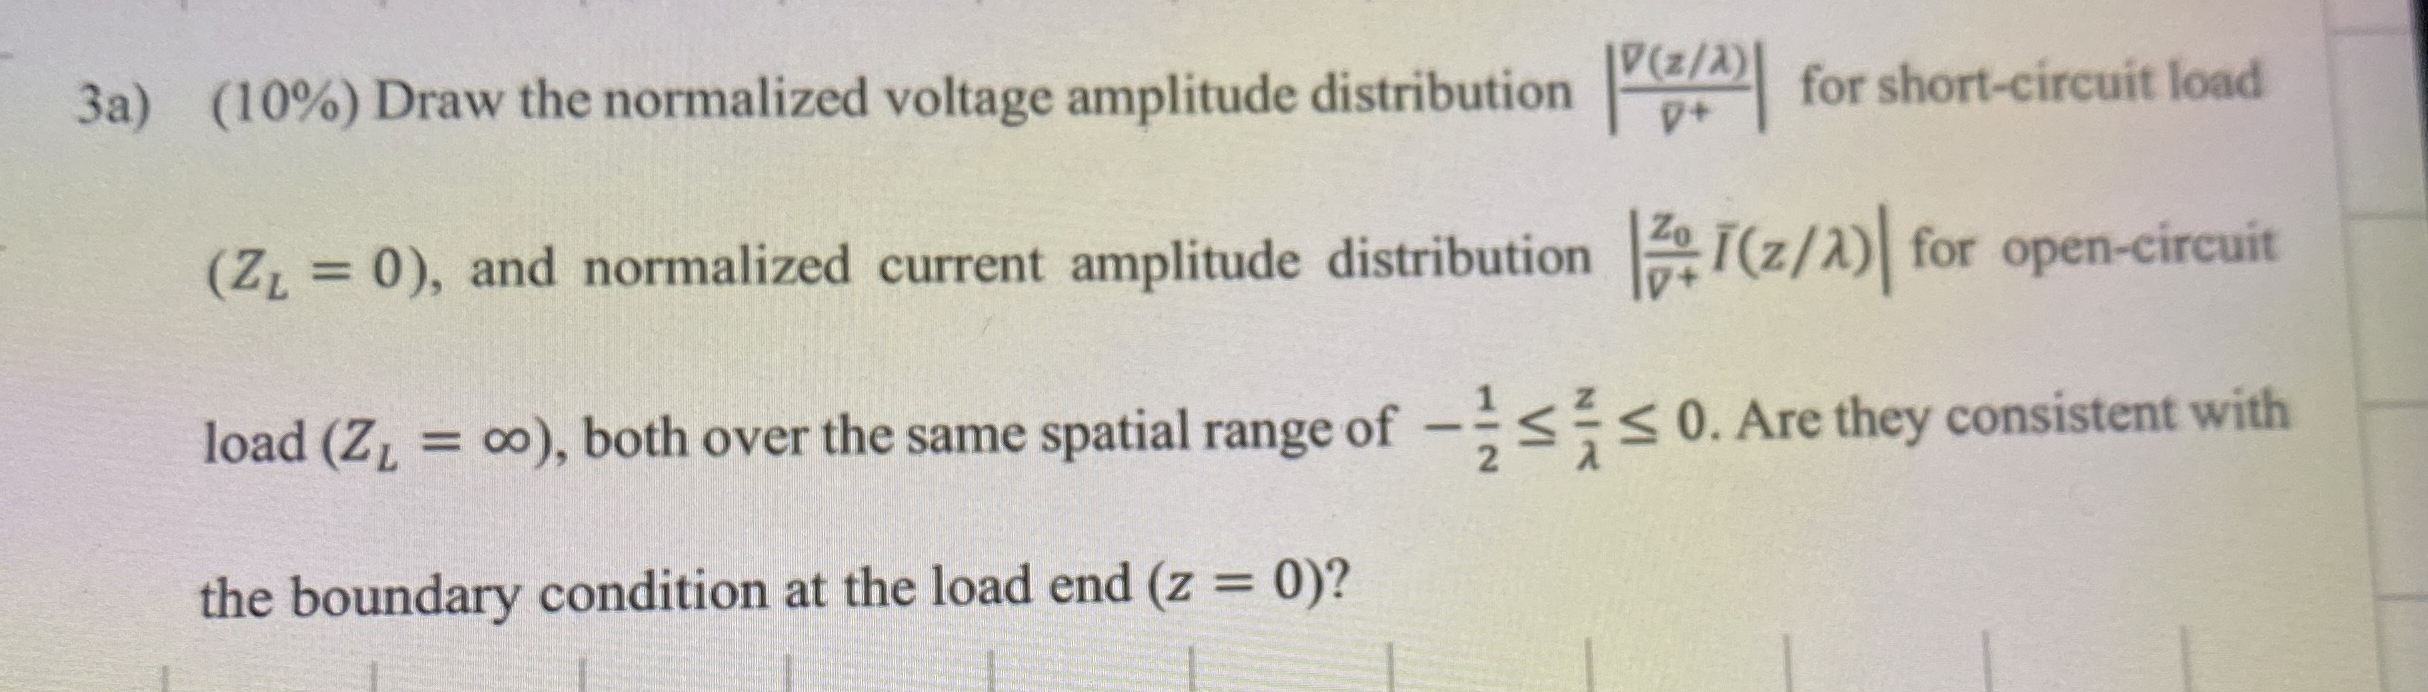
Question: 3 a ) ( 1 0 % ) Draw the normalized voltage amplitude distribution | V ( z ) g r a d + |
a Draw the normalized voltage amplitude distribution for shortcircuit load and normalized current amplitude distribution for opencircuit load both over the same spatial range of Are they consistent with the boundary condition at the load end
Step by Step Solution
There are 3 Steps involved in it
1 Expert Approved Answer
Step: 1 Unlock

Question Has Been Solved by an Expert!
Get step-by-step solutions from verified subject matter experts
Step: 2 Unlock
Step: 3 Unlock