

Question: 3. A bilateral trading example is shown in Figure Q3. In Figure Q3, there are two contracts between one seller and two buyers. Both contracts
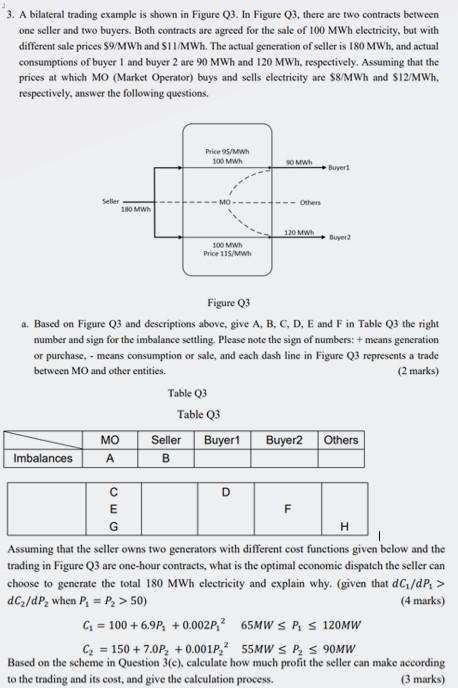
3. A bilateral trading example is shown in Figure Q3. In Figure Q3, there are two contracts between one seller and two buyers. Both contracts are agreed for the sale of 100MWh electricity, but with different sale prices $9/MWh and 51L/MWh. The actual generation of seller is 180MWh, and actual consumptions of buyer 1 and buyer 2 are 90MWh and 120MWh, respectively. Assuming that the prices at which MO (Market Operator) buys and sells electricity are $8/MWh and $12/MWh, respectively, answer the following questions. Figure Q3 a. Based on Figure Q3 and descriptions above, give A,B,C,D,E and F in Table Q3 the right number and sign for the imbalance settling. Please note the sign of numbers: + means generation or purchase, - means consumption or sale, and each dash line in Figure Q3 represents a trade between MO and other entities. ( 2 marks) Table Q3 Table Q3 Assuming that the seller owns two generators with different cost functions given below and the trading in Figure Q3 are one-hour contracts, what is the optimal economie dispatch the seller can choose to generate the total 180MWh electricity and explain why. (given that dC1/dP1> dC2/dP2 when P1=P2>50) (4 marks) C1=100+6.9P1+0.002P1265MWP1120MWC2=150+7.0P2+0.001P2255MWP290MW Based on the scheme in Question 3(c), calculate how much profit the seller can make according to the trading and its cost, and give the calculation process
Step by Step Solution
There are 3 Steps involved in it

Get step-by-step solutions from verified subject matter experts