

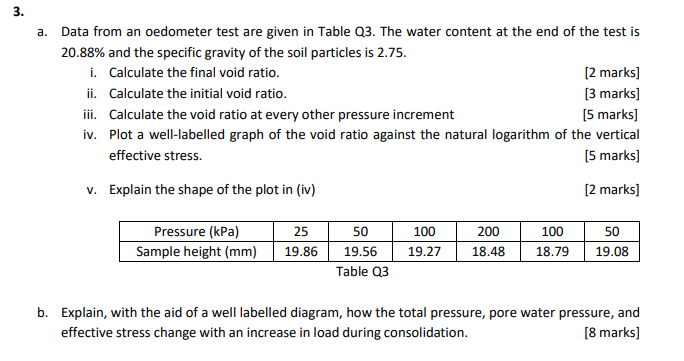
Question: 3 . a . Data from an oedometer test are given in Table Q 3 . The water content at the end of the test
a Data from an oedometer test are given in Table Q The water content at the end of the test is and the specific gravity of the soil particles is
i Calculate the final void ratio.
marks
ii Calculate the initial void ratio.
marks
iii. Calculate the void ratio at every other pressure increment
marks
iv Plot a welllabelled graph of the void ratio against the natural logarithm of the vertical effective stress.
marks
v Explain the shape of the plot in iv
marks
Table Q
b Explain, with the aid of a well labelled diagram, how the total pressure, pore water pressure, and effective stress change with an increase in load during consolidation.
marks
Step by Step Solution
There are 3 Steps involved in it
1 Expert Approved Answer
Step: 1 Unlock

Question Has Been Solved by an Expert!
Get step-by-step solutions from verified subject matter experts
Step: 2 Unlock
Step: 3 Unlock