

Question: 3. A doctor's office staff studied the waiting times for patients who arrive at the office with a request for emergency service. The following
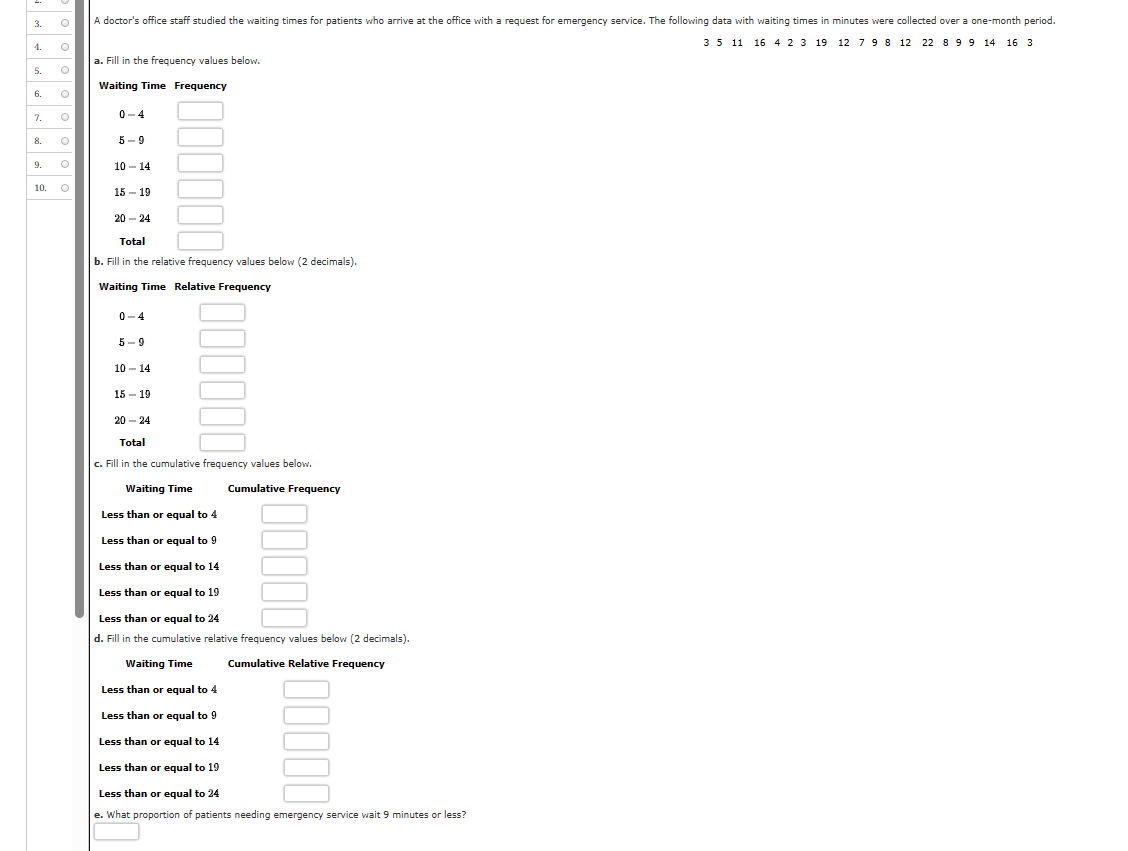
3. A doctor's office staff studied the waiting times for patients who arrive at the office with a request for emergency service. The following data with waiting times in minutes were collected over a one-month period. 35 11 16 4 2 3 19 12 7 9 8 12 22899 14 16 3 4. a. Fill in the frequency values below. 5. Waiting Time Frequency 6. 0-4 7. 8. 5-9 9. 10-14 10. 15-19 20-24 Total b. Fill in the relative frequency values below (2 decimals). Waiting Time Relative Frequency 0-4 5-9 10-14 15-19 20-24 Total c. Fill in the cumulative frequency values below. Waiting Time Cumulative Frequency Less than or equal to 4 Less than or equal to 9 Less than or equal to 14 Less than or equal to 19 Less than or equal to 24 d. Fill in the cumulative relative frequency values below (2 decimals). Waiting Time Less than or equal to 4 Less than or equal to 9 Cumulative Relative Frequency Less than or equal to 14 Less than or equal to 19 Less than or equal to 24 e. What proportion of patients needing emergency service wait 9 minutes or less?
Step by Step Solution
There are 3 Steps involved in it

Get step-by-step solutions from verified subject matter experts