

Question: 3. A quality analyst wants to construct a sample mean chart for controlling a packaging process. He knows from past experience that when the process
3. A quality analyst wants to construct a sample mean chart for controlling a packaging process. He knows from past experience that when the process is operating as intended, packaging weight is normally distributed with a mean of twenty ounces, and a process standard deviation of two ounces. Each day last week, he randomly selected four packages and weighed each. The data from that activity appears below.
hi
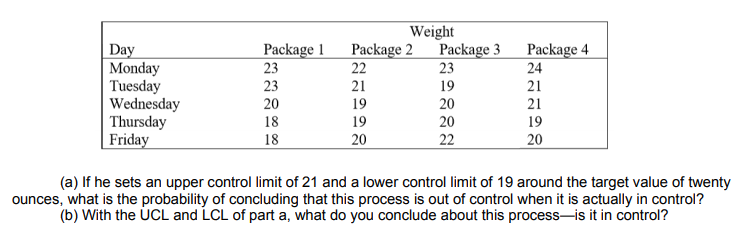
Weight Day Package 1 Package 2 Package 3 Package 4 Monday 23 22 23 24 Tuesday 23 21 19 21 Wednesday 20 19 20 21 Thursday 18 19 20 19 Friday 18 20 22 20 (a) If he sets an upper control limit of 21 and a lower control limit of 19 around the target value of twenty ounces, what is the probability of concluding that this process is out of control when it is actually in control? (b) With the UCL and LCL of part a, what do you conclude about this process-is it in control
Step by Step Solution
There are 3 Steps involved in it

Get step-by-step solutions from verified subject matter experts