

Question: 3. A shark population P is changing with time. The following graph shows the derivative of P. PI (sharks/year) time (years) (a) Given that P(0)
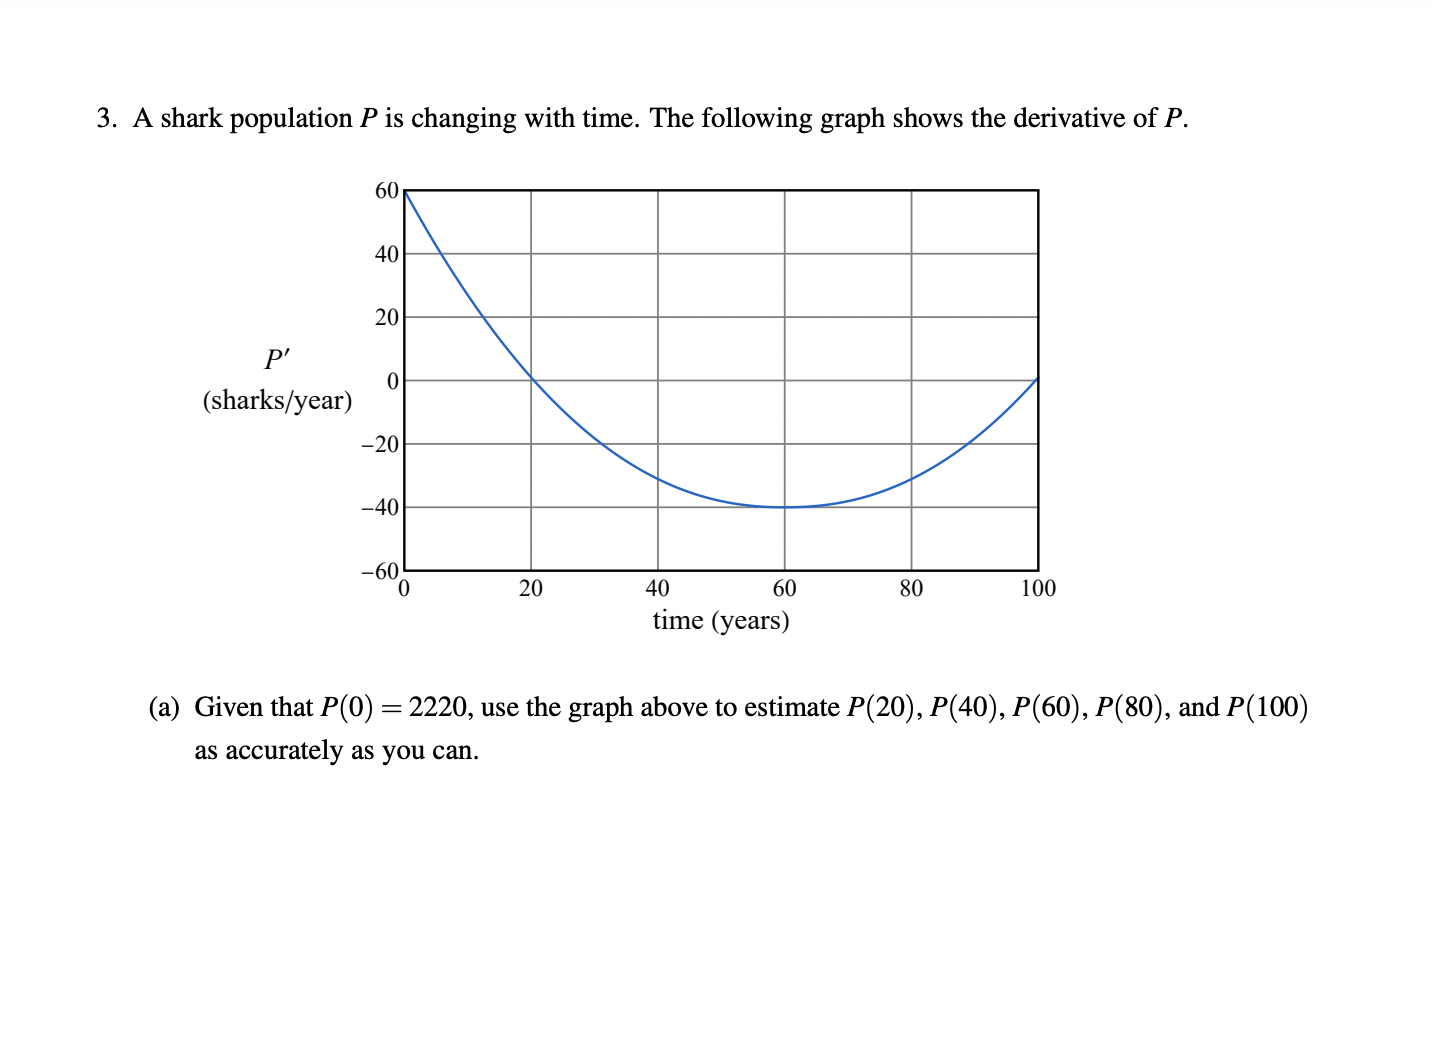

3. A shark population P is changing with time. The following graph shows the derivative of P. PI (sharks/year) time (years) (a) Given that P(0) = 2220, use the graph above to estimate P(20), P(40), P050), P(80), and P000) as accurately as you can
Step by Step Solution
There are 3 Steps involved in it
1 Expert Approved Answer
Step: 1 Unlock

Question Has Been Solved by an Expert!
Get step-by-step solutions from verified subject matter experts
Step: 2 Unlock
Step: 3 Unlock