

Question: 3. A small company makes baseball caps. The graph shows how the cost, sales, and profit change as the number of caps produced increases. 80
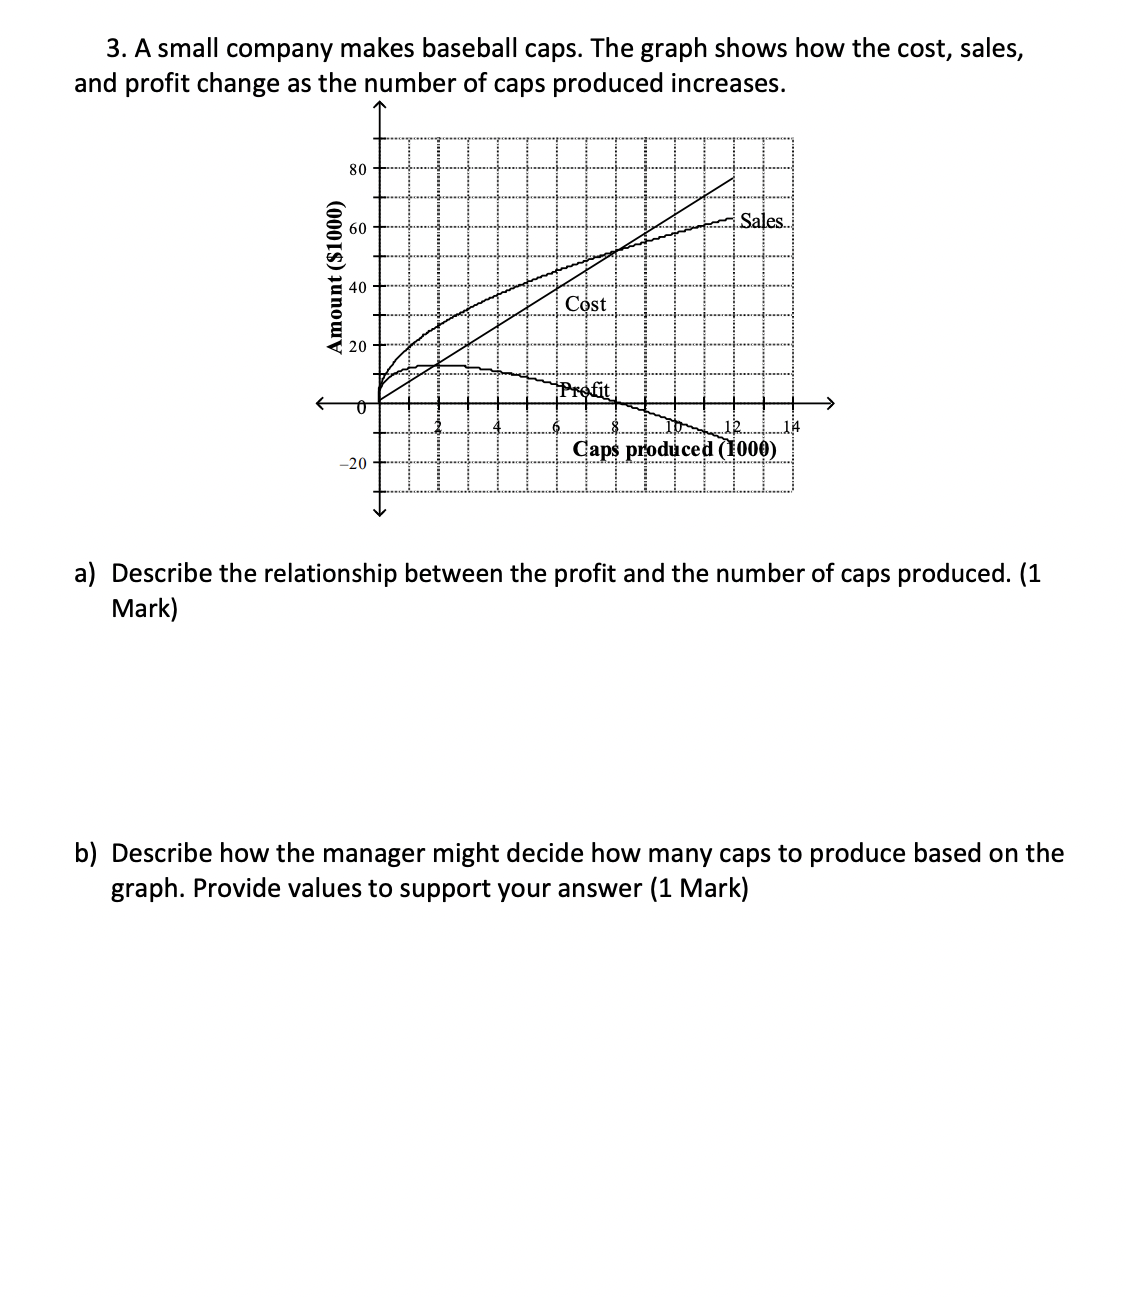 3. A small company makes baseball caps. The graph shows how the cost, sales, and profit change as the number of caps produced increases. 80 + 60 Sales. Amount ($1000) 40 Cost 20 Profit 20 .Caps produced (1000) a) Describe the relationship between the profit and the number of caps produced. (1 Mark) b) Describe how the manager might decide how many caps to produce based on the graph. Provide values to support your answer (1 Mark)
Step by Step Solution
There are 3 Steps involved in it
1 Expert Approved Answer
Step: 1 Unlock

Question Has Been Solved by an Expert!
Get step-by-step solutions from verified subject matter experts
Step: 2 Unlock
Step: 3 Unlock