

Question: 3. (a) What is (rc) contingency table? Construct (44) contingency table. 2 (b) In a study of relation between blood type and disease, a sample
3. (a) What is (rc) contingency table? Construct (44) contingency table. 2
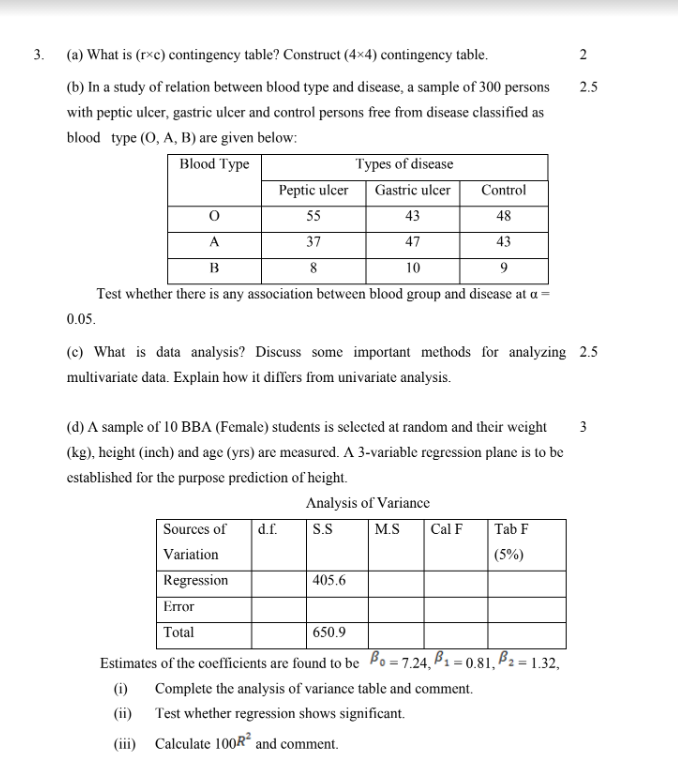
(b) In a study of relation between blood type and disease, a sample of 300 persons 2.5
with peptic ulcer, gastric ulcer and control persons free from disease classified as blood type (O, A, B) are given below:
| Blood Type | Types of disease | ||
| Peptic ulcer | Gastric ulcer | Control | |
| O | 55 | 43 | 48 |
| A | 37 | 47 | 43 |
| B | 8 | 10 | 9 |
Test whether there is any association between blood group and disease at = 0.05.
(c) What is data analysis? Discuss some important methods for analyzing 2.5
multivariate data. Explain how it differs from univariate analysis.
(d) A sample of 10 BBA (Female) students is selected at random and their weight 3
(kg), height (inch) and age (yrs) are measured. A 3-variable regression plane is to be established for the purpose prediction of height.
Analysis of Variance
| Sources of Variation | d.f. | S.S | M.S | Cal F | Tab F (5%) |
| Regression | 405.6 | ||||
| Error | |||||
| Total | 650.9 |
Estimates of the coefficients are found to be = 7.24, = 0.81, = 1.32, (i) Complete the analysis of variance table and comment.
(ii) Test whether regression shows significant.
(iii) Calculate 100 and comment.
Step by Step Solution
There are 3 Steps involved in it

Get step-by-step solutions from verified subject matter experts