Question: 3 a-f This is the 6th time im posting this. I can clearly see it, no one is answering the question. 3. Rise in Obesity
3 a-f
This is the 6th time im posting this. I can clearly see it, no one is answering the question.
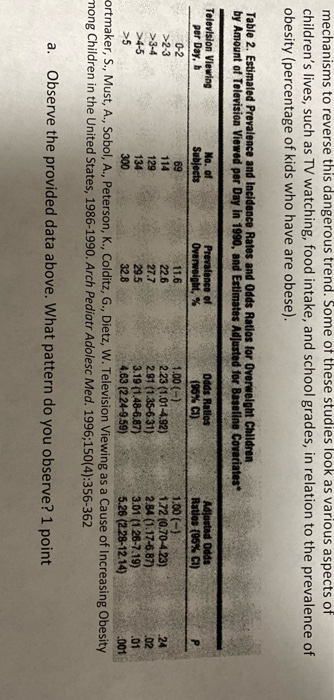
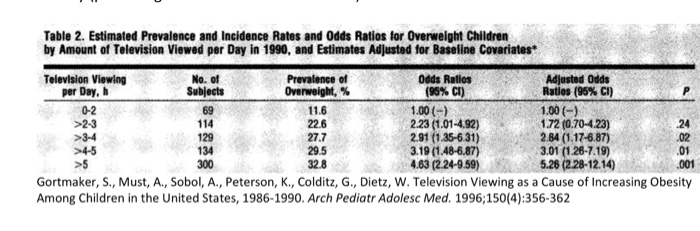
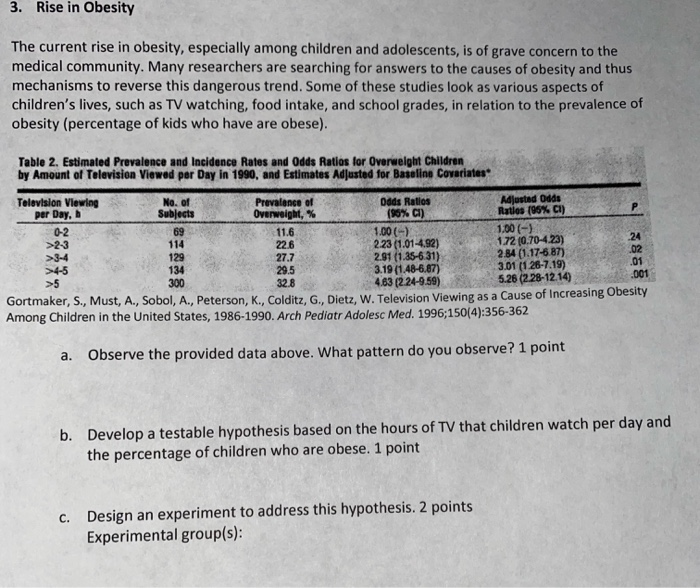
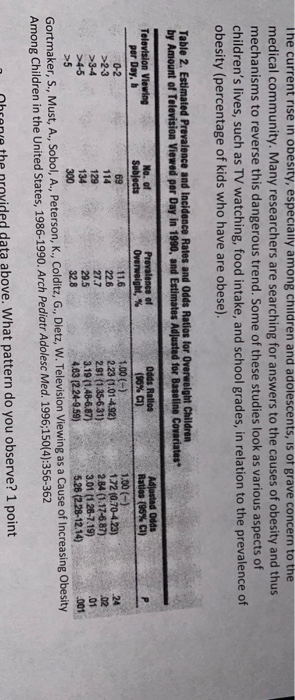
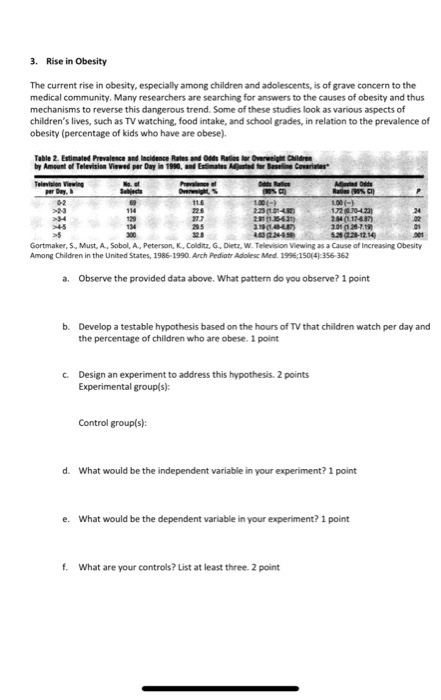
3. Rise in Obesity The current rise in obesity, especially among children and adolescents, is of grave concern to the medical community. Many researchers are searching for answers to the causes of obesity and thus mechanisms to reverse this dangerous trend. Some of these studies look as various aspects of children's lives, such as TV watching food intake, and school grades, in relation to the prevalence of obesity (percentage of kids who have are obese). Table 2. Estimated Preve ncidence Rates d TeleViewed per Daya e Radios M de re e M 1720-21 2015 2 114 314 101 102 2.1 Gortmaker, S. Must, A. Sobol, A., Peterson, K.Coldi G. Dit W. Television Viewing as a Cause of increasing Obesity Among Children in the United States, 1986-1990. Arch Pediatr Adoles Med. 1996;15014356 362 a. Observe the provided data above. What pattern do you observe? 1 point b. Develop a testable hypothesis based on the hours of TV that children watch per day and the percentage of children who are obese. 1 point c. Design an experiment to address this hypothesis. 2 points Experimental group(s): Control group(s): d. What would be the independent variable in your experiment? 1 point e. What would be the dependent variable in your experiment? 1 point f. What are your controls? List at least three 2 point Table 2. Estimated Prevalence and Incidence Rates and Odds Ratios for Overweight Children by Amount of Television Viewed per Day in 1990, and Estimates Adjusted for Baseline Covariates 114 226 24 Television Viewing No. of Prevalence of Odds Rallos Adjusted Odds per Day, b Subjects Overweight, % (95% CI) Ratios (95% CI) 0-2 11.6 1.00(-) 1.00(-) >2-3 2.23 (1.01-4.92) 172 (0.70-4.23) >3-4 2.91 (1.35-6.31) 2.84 (1.17-6.87) >4-5 3.19 (1.48-6.87) 3.01 (1.26-7.19) .01 >5 4.63 (2.24-9.59) 5.26 (228-12.14) 001 Gortmaker, S., Must, A., Sobol, A., Peterson, K., Colditz, G., Dietz, W. Television Viewing as a Cause of increasing Obesity Among Children in the United States, 1986-1990. Arch Pediatr Adolesc Med. 1996;150(4):356-362 129 27.7 295 mechanisms to reverse this dangerous trend. Some of these studies look as various aspects of children's lives, such as TV watching, food intake, and school grades, in relation to the prevalence of obesity (percentage of kids who have are obese). Table 2. Estimated Prevalence and Incidence Rates and Odds Ratios for overweight Children by Amount of Television Viewed per Day in 1990, and Estimates Adjusted for Baseline Covariates 114 Television Viewing No. of Prevalence of Odds Ratios Adjusted Odds per Day, b Subjects Overweight, % (95% CI) Ratios (95% CI) 02 69 11.6 1.00 (-) 1.60 (-) >2-3 226 2.23 (1.01-492) 1.72 (0.70-423) >3-4 129 27.7 2.81 (1.35-6.31) 2.84 (1.17-6.87) >4-5 3.19 (1.48-6.87) 3.01 (1 26-7.19) >5 300 4.63 (2.24-9.59) 5.26 (2.28-12.14) .001 ortmaker, S., Must, A., Sobol, A., Peterson, K., Colditz, G., Dietz, W. Television Viewing as a Cause of increasing Obesity mong Children in the United States, 1986-1990. Arch Pediatr Adolesc Med. 1996;150(4):356-362 . 134 29.5 a. Observe the provided data above. What pattern do you observe? 1 point 3. Rise in Obesity The current rise in obesity, especially among children and adolescents, is of grave concern to the medical community. Many researchers are searching for answers to the causes of obesity and thus mechanisms to reverse this dangerous trend. Some of these studies look as various aspects of children's lives, such as TV watching, food intake, and school grades, in relation to the prevalence of obesity (percentage of kids who have are obese). Table 2. Estimated Prevalence and Incidence Rates and Odds Ratios for Overweight Children by Amount of Television Viewed per Day in 1990, and Estimates Adjusted for Baseline Covariates 24 02 Television Viewing No. of Prevalence of Odds Ratios Adjusted Odds per Day, Subjects Overweight, (95% CI) Ratios (95% CI) 02 11.6 1.00(-) 1.00(-) >2-3 114 226 2.23 (1.01-4.92) 172 0.70-4.23) 27.7 2.91 (1.35-6.31) 2 B4 (1.17-6 87) 29.5 3.19 (1.48-6.87) 3.01 (126-7.19) 32.8 4.63 (224-9.59) 5.26 (228-12.14) Gortmaker. S.. Must. A.. Sobol, A., Peterson, K., Colditz, G., Dietz, W. Television Viewing as a cause of incred Among Children in the United States, 1986-1990. Arch Pediatr Adolesc Med. 1996;150(4):356-362 129 134 .001 300 a. Observe the provided data above. What pattern do you observe? 1 point b. Develop a testable hypothesis based on the hours of TV that children watch per day and the percentage of children who are obese. 1 point C. Design an experiment to address this hypothesis. 2 points Experimental group(s): The current rise in obesity, especially among children and adolescents, is of grave concern to the medical community. Many researchers are searching for answers to the causes of obesity and thus mechanisms to reverse this dangerous trend. Some of these studies look as various aspects of children's lives, such as TV watching, food intake, and school grades, in relation to the prevalence of obesity (percentage of kids who have are obese). Table 2. Estimated Prevalence and Incidence Rates and Odds Ratios for Overweight Children by Amount of Television Viewed per Day in 1990, and Estimates Adjusted for Baseline Covariates Television Viewing No. of Prevalence of Odds Ratios Adjustad Odds per Day, Subjects Overweight, % (95% CI) Ratio (95% CI) 0-2 11.6 1.00 (-) 1.00(-) >2-3 226 2.23 (1.01-492) 172(0.70-4.23) >3-4 27.7 2.91 (1.35-631) 2.84 (1.17-687) >4-5 134 29.5 3.19 (1.48-6.87) 3.01 (126-7.19) 4.63 (224-9.59) 5.26 (228-12.14) 32.8 .001 >5 360 Gortmaker, S., Must, A., Sobol, A., Peterson, K., Colditz, G., Dietz, W. Television Viewing as a Cause of increasing Obesity Among Children in the United States, 1986-1990. Arch Pediatr Adolesc Med. 1996;150(4):356-362 nhranje the nrovided data above. What pattern do you observe? 1 point 3. Rise in Obesity The current rise in obesity, especially among children and adolescents, is of grave concern to the medical community. Many researchers are searching for answers to the causes of obesity and thus mechanisms to reverse this dangerous trend. Some of these studies look as various aspects of children's lives, such as TV watching food intake, and school grades, in relation to the prevalence of obesity (percentage of kids who have are obese). Table 2. Estimated Preve ncidence Rates d TeleViewed per Daya e Radios M de re e M 1720-21 2015 2 114 314 101 102 2.1 Gortmaker, S. Must, A. Sobol, A., Peterson, K.Coldi G. Dit W. Television Viewing as a Cause of increasing Obesity Among Children in the United States, 1986-1990. Arch Pediatr Adoles Med. 1996;15014356 362 a. Observe the provided data above. What pattern do you observe? 1 point b. Develop a testable hypothesis based on the hours of TV that children watch per day and the percentage of children who are obese. 1 point c. Design an experiment to address this hypothesis. 2 points Experimental group(s): Control group(s): d. What would be the independent variable in your experiment? 1 point e. What would be the dependent variable in your experiment? 1 point f. What are your controls? List at least three 2 point Table 2. Estimated Prevalence and Incidence Rates and Odds Ratios for Overweight Children by Amount of Television Viewed per Day in 1990, and Estimates Adjusted for Baseline Covariates 114 226 24 Television Viewing No. of Prevalence of Odds Rallos Adjusted Odds per Day, b Subjects Overweight, % (95% CI) Ratios (95% CI) 0-2 11.6 1.00(-) 1.00(-) >2-3 2.23 (1.01-4.92) 172 (0.70-4.23) >3-4 2.91 (1.35-6.31) 2.84 (1.17-6.87) >4-5 3.19 (1.48-6.87) 3.01 (1.26-7.19) .01 >5 4.63 (2.24-9.59) 5.26 (228-12.14) 001 Gortmaker, S., Must, A., Sobol, A., Peterson, K., Colditz, G., Dietz, W. Television Viewing as a Cause of increasing Obesity Among Children in the United States, 1986-1990. Arch Pediatr Adolesc Med. 1996;150(4):356-362 129 27.7 295 mechanisms to reverse this dangerous trend. Some of these studies look as various aspects of children's lives, such as TV watching, food intake, and school grades, in relation to the prevalence of obesity (percentage of kids who have are obese). Table 2. Estimated Prevalence and Incidence Rates and Odds Ratios for overweight Children by Amount of Television Viewed per Day in 1990, and Estimates Adjusted for Baseline Covariates 114 Television Viewing No. of Prevalence of Odds Ratios Adjusted Odds per Day, b Subjects Overweight, % (95% CI) Ratios (95% CI) 02 69 11.6 1.00 (-) 1.60 (-) >2-3 226 2.23 (1.01-492) 1.72 (0.70-423) >3-4 129 27.7 2.81 (1.35-6.31) 2.84 (1.17-6.87) >4-5 3.19 (1.48-6.87) 3.01 (1 26-7.19) >5 300 4.63 (2.24-9.59) 5.26 (2.28-12.14) .001 ortmaker, S., Must, A., Sobol, A., Peterson, K., Colditz, G., Dietz, W. Television Viewing as a Cause of increasing Obesity mong Children in the United States, 1986-1990. Arch Pediatr Adolesc Med. 1996;150(4):356-362 . 134 29.5 a. Observe the provided data above. What pattern do you observe? 1 point 3. Rise in Obesity The current rise in obesity, especially among children and adolescents, is of grave concern to the medical community. Many researchers are searching for answers to the causes of obesity and thus mechanisms to reverse this dangerous trend. Some of these studies look as various aspects of children's lives, such as TV watching, food intake, and school grades, in relation to the prevalence of obesity (percentage of kids who have are obese). Table 2. Estimated Prevalence and Incidence Rates and Odds Ratios for Overweight Children by Amount of Television Viewed per Day in 1990, and Estimates Adjusted for Baseline Covariates 24 02 Television Viewing No. of Prevalence of Odds Ratios Adjusted Odds per Day, Subjects Overweight, (95% CI) Ratios (95% CI) 02 11.6 1.00(-) 1.00(-) >2-3 114 226 2.23 (1.01-4.92) 172 0.70-4.23) 27.7 2.91 (1.35-6.31) 2 B4 (1.17-6 87) 29.5 3.19 (1.48-6.87) 3.01 (126-7.19) 32.8 4.63 (224-9.59) 5.26 (228-12.14) Gortmaker. S.. Must. A.. Sobol, A., Peterson, K., Colditz, G., Dietz, W. Television Viewing as a cause of incred Among Children in the United States, 1986-1990. Arch Pediatr Adolesc Med. 1996;150(4):356-362 129 134 .001 300 a. Observe the provided data above. What pattern do you observe? 1 point b. Develop a testable hypothesis based on the hours of TV that children watch per day and the percentage of children who are obese. 1 point C. Design an experiment to address this hypothesis. 2 points Experimental group(s): The current rise in obesity, especially among children and adolescents, is of grave concern to the medical community. Many researchers are searching for answers to the causes of obesity and thus mechanisms to reverse this dangerous trend. Some of these studies look as various aspects of children's lives, such as TV watching, food intake, and school grades, in relation to the prevalence of obesity (percentage of kids who have are obese). Table 2. Estimated Prevalence and Incidence Rates and Odds Ratios for Overweight Children by Amount of Television Viewed per Day in 1990, and Estimates Adjusted for Baseline Covariates Television Viewing No. of Prevalence of Odds Ratios Adjustad Odds per Day, Subjects Overweight, % (95% CI) Ratio (95% CI) 0-2 11.6 1.00 (-) 1.00(-) >2-3 226 2.23 (1.01-492) 172(0.70-4.23) >3-4 27.7 2.91 (1.35-631) 2.84 (1.17-687) >4-5 134 29.5 3.19 (1.48-6.87) 3.01 (126-7.19) 4.63 (224-9.59) 5.26 (228-12.14) 32.8 .001 >5 360 Gortmaker, S., Must, A., Sobol, A., Peterson, K., Colditz, G., Dietz, W. Television Viewing as a Cause of increasing Obesity Among Children in the United States, 1986-1990. Arch Pediatr Adolesc Med. 1996;150(4):356-362 nhranje the nrovided data above. What pattern do you observe? 1 point