

Question: 3) Assume that we have a transportation map that includes three origin points, two transshipment points, and three destinstion points as in the figure beiow.
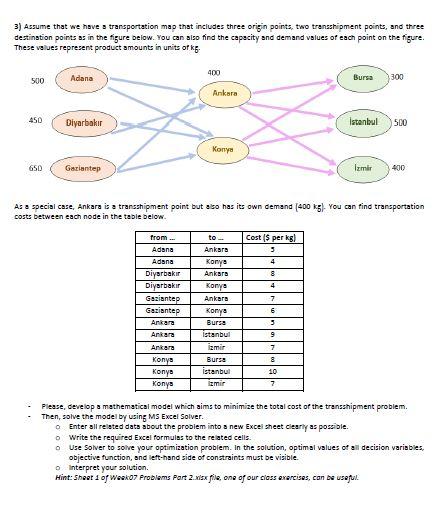
3) Assume that we have a transportation map that includes three origin points, two transshipment points, and three destinstion points as in the figure beiow. You can slso find the capacity and demand values of each point on the figure. These values represent product amounts in units of k. As a special case, Ankara is a transshipment point but a so has its own demand [400 kg]. You can find transportation costs between each node in the table below. \begin{tabular}{|c|c|c|} \hline from ... & to - & Cost [$ per kg \\ \hline Adsna & Anksrs & 9 \\ \hline Adsna & Korys & 4 \\ \hline Diysrbakir & Anksrs & 8 \\ \hline Diysrbakir & Korys & 4 \\ \hline Gaziantep & Ankars & 7 \\ \hline Gaziantep & Konya & 6 \\ \hline Arkara & Bursa & 9 \\ \hline Arkara & Iatanbul & 9 \\ \hline Arkara & limir & 7 \\ \hline Konys & Bursa & 8 \\ \hline Konys & istanbul & 10 \\ \hline Konys & lamir & 7 \\ \hline \end{tabular} - Please, develop a mathematical model which aims to minimize the total cost of the transshipment problem. - Then, solve the model by using MS Excel Solver. Enter all releted data sbout the problem into a new Excel sheet claarly as possible. Write the required Excel formulas to the related cells. Use Solver to solve your optimization problem. In the solution, optimal values of all decision variables. objective function, and left-hand side of constraints must be visible. D. interpret your solution. Hint: Sheet 1 of Wesko7 froblems Port 2. nisx file, one of our cioss evercises, can be useful
Step by Step Solution
There are 3 Steps involved in it

Get step-by-step solutions from verified subject matter experts