

Question: 3. Based on case Analysis: DELISLE Industries_Ratio Analysis A. Prepare the following financial exhibits for 2010: i. Calculate the relevant ratios from (Exhibit 1&2) Current
3. Based on case Analysis: DELISLE Industries_Ratio Analysis A. Prepare the following financial exhibits for 2010: i. Calculate the relevant ratios from (Exhibit 1&2)
Current ratio Cash ratio RM turnover in days WIP turnover in days Finished goods turnover in days A/R turnover in days A/P turnover in days Cash conversion cycle Fixed assets turnover Total assets turnover Long-term debt to total capitalization Cash flow coverage Gross profit margin Operating profit margin Net profit margin Return on assets Return on equity
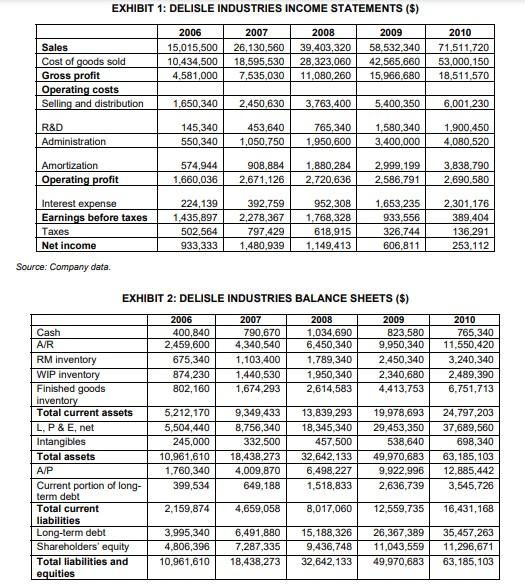
EXHIBIT 1: DELISLE INDUSTRIES INCOME STATEMENTS ($) Sales Cost of goods sold Gross profit Operating costs Selling and distribution 2006 15.015,500 10,434,500 4,581,000 2007 26,130.560 18,595,530 7,535,030 2008 39,403,320 28,323,060 11.080,260 2009 58,532,340 42.565,660 15.966.680 2010 71,511,720 53,000.150 18,511,570 1,650,340 2,450,630 3,763,400 5,400,350 6,001 230 R&D Administration 145,340 550,340 453,640 1,050.750 765,340 1.950,600 1,580,340 3.400.000 1,900.450 4,080,520 Amortization Operating profit 574,944 1,660,036 908,884 2,671,126 1,880,284 2.720,636 2.999.199 2,586,791 3,838,790 2,690.580 Interest expense Earnings before taxes Taxes Net income 224,139 1,435,897 502,564 933,333 392.759 2,278,367 797,429 1.480.939 952,308 1,768,328 618,915 1.149,413 1.653,235 933,556 326.744 606,811 2.301,176 389,404 136 291 253.112 Source: Company data EXHIBIT 2: DELISLE INDUSTRIES BALANCE SHEETS ($) 2006 400,840 2,459,600 675,340 874,230 802,160 2007 790,670 4,340.540 1,103.400 1,440,530 1,674.293 2008 1,034,690 6,450,340 1.789,340 1.950,340 2,614,583 2009 823.580 9.950.340 2.450,340 2,340,680 4,413,753 2010 765,340 11,550,420 3,240,340 2.489,390 6.751,713 Cash A/R RM Inventory WIP inventory Finished goods inventory Total current assets L, P & E, net Intangibles Total assets A/P Current portion of long- term debt Total current liabilities Long-term debt Shareholders' equity Total liabilities and equities 5,212,170 5,504,440 245.000 10.961.610 1.760,340 399,534 9,349.433 8,756,340 332,500 18,438,273 4,009,870 649,188 13.839,293 18,345,340 457,500 32,642,133 6,498,227 1,518,833 19,978,693 29,453,350 538,640 49.970,683 9,922.996 2,636,739 24.797,203 37,689,560 698,340 63,185,103 12,885,442 3,545,726 2.159,874 4,659,058 8,017,060 12.559.735 16,431,168 3.995,340 4,806,396 10.961,610 6,491,880 7,287,335 18,438,273 15,188,326 9,436,748 32.642,133 26,367,389 11,043,559 49,970,683 35,457,263 11,296,671 63,185,103 EXHIBIT 1: DELISLE INDUSTRIES INCOME STATEMENTS ($) Sales Cost of goods sold Gross profit Operating costs Selling and distribution 2006 15.015,500 10,434,500 4,581,000 2007 26,130.560 18,595,530 7,535,030 2008 39,403,320 28,323,060 11.080,260 2009 58,532,340 42.565,660 15.966.680 2010 71,511,720 53,000.150 18,511,570 1,650,340 2,450,630 3,763,400 5,400,350 6,001 230 R&D Administration 145,340 550,340 453,640 1,050.750 765,340 1.950,600 1,580,340 3.400.000 1,900.450 4,080,520 Amortization Operating profit 574,944 1,660,036 908,884 2,671,126 1,880,284 2.720,636 2.999.199 2,586,791 3,838,790 2,690.580 Interest expense Earnings before taxes Taxes Net income 224,139 1,435,897 502,564 933,333 392.759 2,278,367 797,429 1.480.939 952,308 1,768,328 618,915 1.149,413 1.653,235 933,556 326.744 606,811 2.301,176 389,404 136 291 253.112 Source: Company data EXHIBIT 2: DELISLE INDUSTRIES BALANCE SHEETS ($) 2006 400,840 2,459,600 675,340 874,230 802,160 2007 790,670 4,340.540 1,103.400 1,440,530 1,674.293 2008 1,034,690 6,450,340 1.789,340 1.950,340 2,614,583 2009 823.580 9.950.340 2.450,340 2,340,680 4,413,753 2010 765,340 11,550,420 3,240,340 2.489,390 6.751,713 Cash A/R RM Inventory WIP inventory Finished goods inventory Total current assets L, P & E, net Intangibles Total assets A/P Current portion of long- term debt Total current liabilities Long-term debt Shareholders' equity Total liabilities and equities 5,212,170 5,504,440 245.000 10.961.610 1.760,340 399,534 9,349.433 8,756,340 332,500 18,438,273 4,009,870 649,188 13.839,293 18,345,340 457,500 32,642,133 6,498,227 1,518,833 19,978,693 29,453,350 538,640 49.970,683 9,922.996 2,636,739 24.797,203 37,689,560 698,340 63,185,103 12,885,442 3,545,726 2.159,874 4,659,058 8,017,060 12.559.735 16,431,168 3.995,340 4,806,396 10.961,610 6,491,880 7,287,335 18,438,273 15,188,326 9,436,748 32.642,133 26,367,389 11,043,559 49,970,683 35,457,263 11,296,671 63,185,103
Step by Step Solution
There are 3 Steps involved in it

Get step-by-step solutions from verified subject matter experts