

Question: 3) Below is a screenshot of a correlation between two quiz scores, Quiz 1 and Quiz 2. These are not real data (I made them
3) Below is a screenshot of a correlation between two quiz scores, Quiz 1 and Quiz 2. These are not real data (I made them for this example), but if they were what might you tell me about the results (.05 significance value)? Please also provide a brief description of the mean and standard deviation as well (under "descriptive statistics"). For an excellent example of how to interpret a correlation table see the following link created by ASK Brunel (2012/13): https://www.youtube.com/watch?v=pgQ9T_SdzoQ
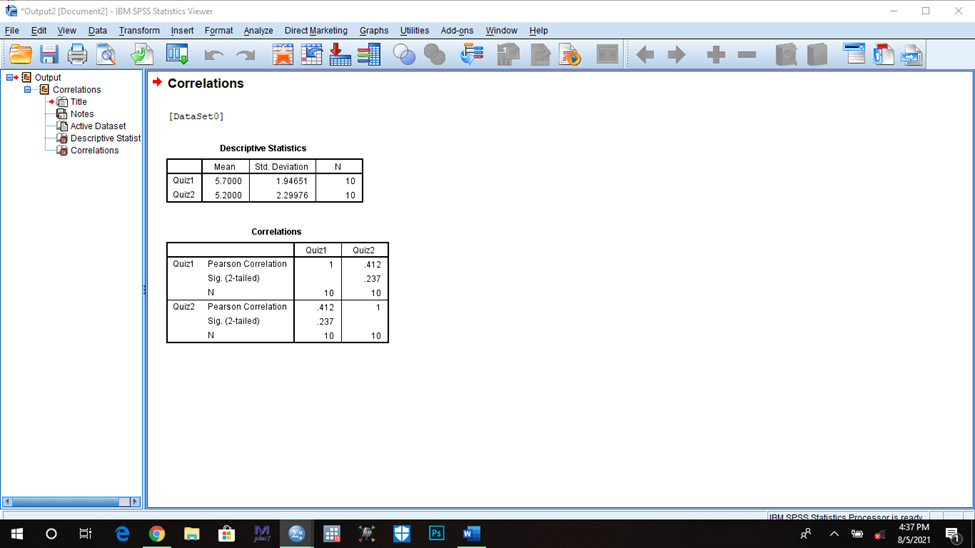
"Output2 [Document2] - IBM SPSS Statistics Viewer X File Edit View Data Transform Insert Format Analyze Direct Marketing Graphs Utilities Add-ons Window Help 8+ Output C) Correlations + Correlations Title Notes [DataSet0] Active Dataset "Descriptive Statist On Correlations Descriptive Statistics Mean Std. Deviation N Quiz 5.7000 1.94651 10 Quiz2 5.2000 2.29976 10 Correlations Quizi Quiz2 Quiz1 Pearson Correlation 412 Sig. (2-tailed) .237 N 10 10 Quiz2 Pearson Correlation 412 Sig. (2-tailed) 237 N 10 Inel segg Statistics Processor is ready 4:37 PM M PS W A 9 8/5/2021
Step by Step Solution
There are 3 Steps involved in it

Get step-by-step solutions from verified subject matter experts