

Question: 3. Below is the data collected on the first day class in one of my statistics classes, in response to the question How tall
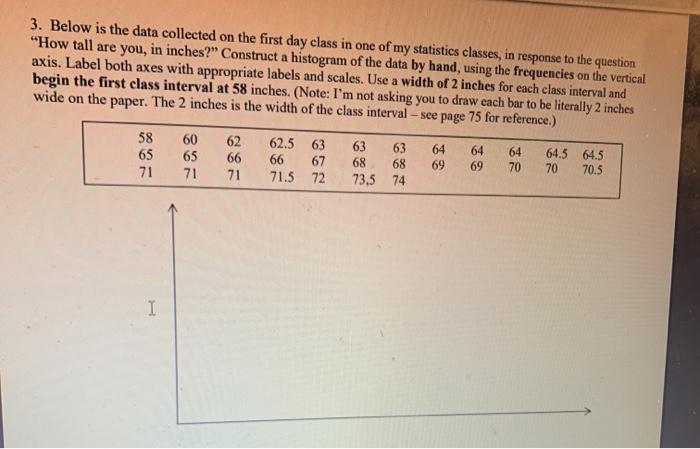
3. Below is the data collected on the first day class in one of my statistics classes, in response to the question "How tall are you, in inches?" Construct a histogram of the data by hand, using the frequencies on the vertical axis. Label both axes with appropriate labels and scales. Use a width of 2 inches for each class interval and begin the first class interval at 58 inches. (Note: I'm not asking you to draw each bar to be literally 2 inches wide on the paper. The 2 inches is the width of the class interval - see page 75 for reference.) 58 65 71 867 60 62 62.5 63 63 63 64 65 66 66 67 68 68 69 489 64 69 71 71 71.5 72 73.5 74 I 4 70 64 64.5 64.5 70 70 70.5
Step by Step Solution
There are 3 Steps involved in it

Get step-by-step solutions from verified subject matter experts