

Question: 3. Bevington 3.9 [Write Python code to do calculations & Plot 3.9. Students in the undergraduate laboratory recorded the following counts in 1-min in- tervals
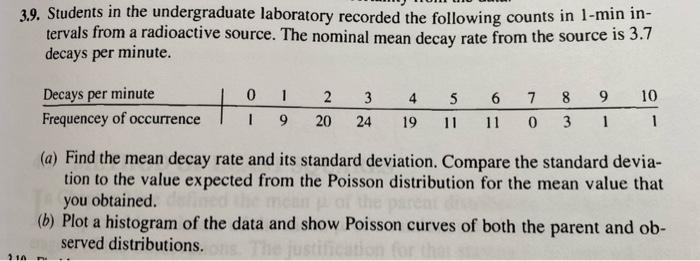
3. Bevington 3.9 [Write Python code to do calculations & Plot 3.9. Students in the undergraduate laboratory recorded the following counts in 1-min in- tervals from a radioactive source. The nominal mean decay rate from the source is 3.7 decays per minute. 0 1 2 3 4 6 7 8 10 Decays per minute Frequencey of occurrence 5 11 9 1 1 9 20 24 19 11 0 3 1 (a) Find the mean decay rate and its standard deviation. Compare the standard devia- tion to the value expected from the Poisson distribution for the mean value that you obtained. (b) Plot a histogram of the data and show Poisson curves of both the parent and ob- served distributions. 11A
Step by Step Solution
There are 3 Steps involved in it
1 Expert Approved Answer
Step: 1 Unlock

Question Has Been Solved by an Expert!
Get step-by-step solutions from verified subject matter experts
Step: 2 Unlock
Step: 3 Unlock