

Question: 3 causes: 1. Unit Aspects if an acceptable contribution margin, but low profit 2. WTA / Cost Aspects look at these first if you are
3 causes: 1. Unit Aspects if an acceptable contribution margin, but low profit 2. WTA / Cost Aspects look at these first if you are using a cost advantage strategy 3. WTP / Demand Aspects look at these first if you are using a benefit advantage strategy
Here is the data.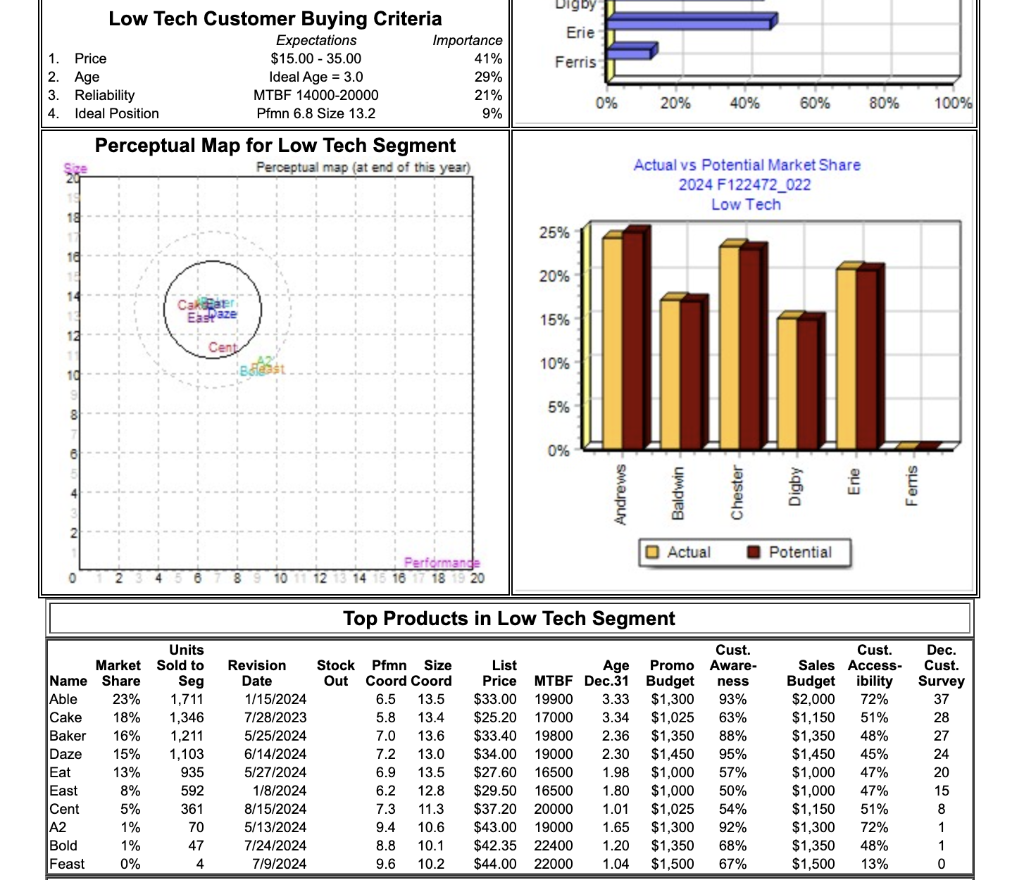
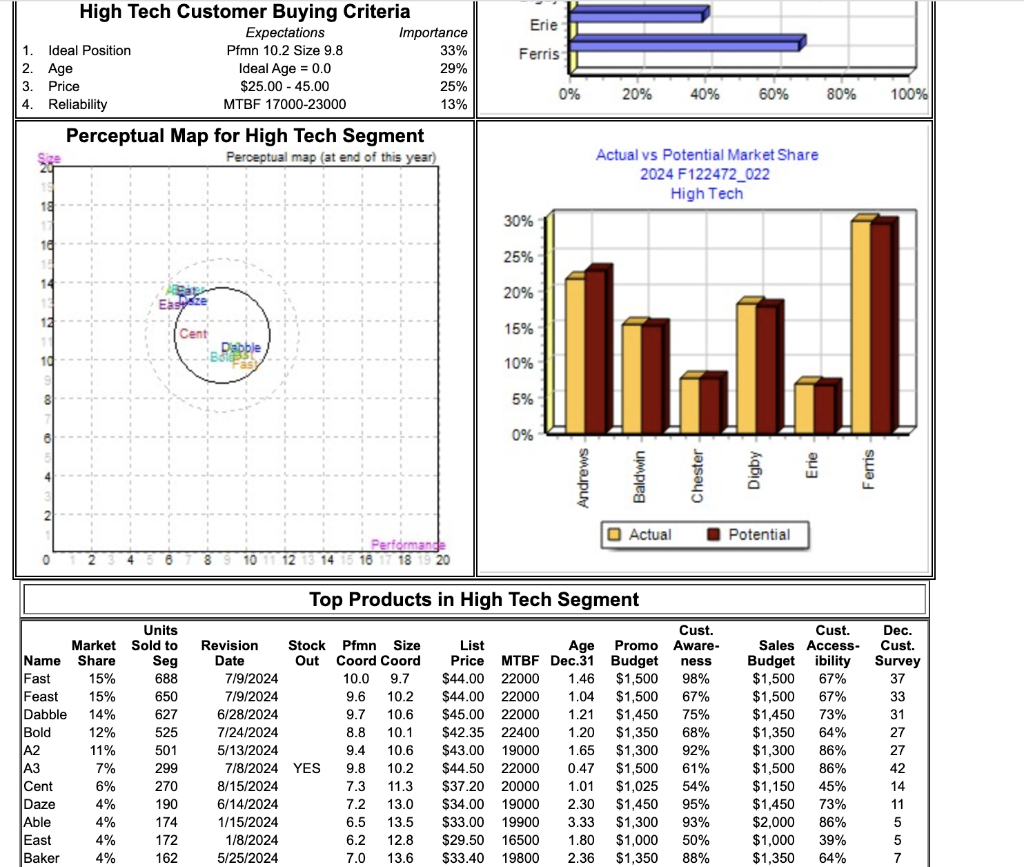
Using Foundation data from round 4, use your company annual report to identify your situational priorities. Specifically, identify the products which are priority #1 and #2. Be specific in explaining the cause(s) (i.e., identify specific price, costs, product attribute such as position cost, labor cost, etc.). Lastly, explain what you are going to do to improve product profitability. (1) Identified 2 products as situational priorities, for each: (2) identifies at least two causes of low profitability, (3) uses appropriate metrics to quantify the causes, provides appropriate context and comparison, (4) presents a plan for improvement which is consistent with business-level strategy and the cause of low profit, and (5) uses at least one trend and forecasted value to identify 1. Unit Aspects if an acceptable contribution margin, but low profit 2. WTA/ Cost Aspects look at these first if you are using a cost advantage strategy 3. WTP / Demand Aspects look at these first if you are using a benefit advantage strategy 1. Situational Priority #1 is: 1.A. Cause of the product low performance is: 1.B The plan to improve profitability consistent with our business-level strategy is: Digby Erie Low Tech Customer Buying Criteria Expectations Importance 1. Price $15.00 - 35.00 41% 2. Age Ideal Age = 3.0 29% 3. Reliability MTBF 14000-20000 21% 4. Ideal Position Pfmn 6.8 Size 13.2 9% Ferris 0% 20% 40% 60% 80% 100% Perceptual Map for Low Tech Segment Perceptual map (at end of this year) Actual vs Potential Market Share 2024 F122472_022 Low Tech 25% 20% Carigar EasPaze 15% 10% 5% 0% O Actual Potential Performand 16 18 19 20 Top Products in Low Tech Segment Units Market Sold to Name Share Seg Able 23% 1,711 Cake 18% 1,346 Baker 16% 1,211 Daze 15% 1,103 Eat 13% 935 East 8% 592 Cent 5% 361 A2 1% 70 Bold 1% 47 Feast 0% 4 Revision Date 1/15/2024 7/28/2023 5/25/2024 6/14/2024 5/27/2024 1/8/2024 8/15/2024 5/13/2024 7/24/2024 7/9/2024 Stock Pfmn Size Out Coord Coord 6.5 13.5 5.8 13.4 7.0 13.6 7.2 13.0 6.9 13.5 6.2 12.8 7.3 11.3 9.4 10.6 8.8 10.1 9.6 10.2 Cust. List Age Promo Aware- Price MTBF Dec.31 Budget ness $33.00 19900 3.33 $1,300 93% $25.20 17000 3.34 $1,025 63% $33.40 19800 2.36 $1,350 88% $34.00 19000 2.30 $1,450 95% $27.60 16500 1.98 $1,000 57% $29.50 16500 1.80 $1,000 50% $37.20 20000 1.01 $1,025 54% $43.00 19000 1.65 $1,300 92% $42.35 22400 1.20 $1,350 68% $44.00 22000 1.04 $1,500 67% Cust. Sales Access- Budget ibility $2,000 72% $1,150 51% $1,350 48% $1,450 45% $1,000 47% $1,000 47% $1,150 51% $1,300 72% $1,350 48% $1,500 13% Dec. Cust. Survey 37 28 27 24 20 15 8 1 1 0 Erie High Tech Customer Buying Criteria Expectations Importance 1. Ideal Position Pfmn 10.2 Size 9.8 33% 2. Age Ideal Age = 0.0 29% 3. Price $25.00 - 45.00 25% 4. Reliability MTBF 17000-23000 13% Ferris 0% 20% 40% 60% 80% 100% Perceptual Map for High Tech Segment Perceptual map (at end of this year) Actual vs Potential Market Share 2024 F122472_022 High Tech 30% 25% 20% Cent 15% lu 10% 5% 0% 0 Actual Potential 10 12 Performand 16 17 18 19 20 14 Top Products in High Tech Segment Stock Seg Units Market Sold to Name Share Fast 15% 688 Feast 15% 650 Dabble 14% 627 Bold 12% 525 A2 11% 501 A3 7% 299 Cent 6% 270 Daze 4% 190 Able 4% 174 East 4% 172 Baker 4% 162 Revision Date Out 7/9/2024 7/9/2024 6/28/2024 7/24/2024 5/13/2024 7/8/2024 YES 8/15/2024 6/14/2024 1/15/2024 1/8/2024 5/25/2024 Pfmn Size Coord Coord 10.0 9.7 9.6 10.2 9.7 10.6 8.8 10.1 9.4 10.6 9.8 10.2 7.3 11.3 7.2 13.0 6.5 13.5 6.2 12.8 7.0 13.6 Cust. List Age Promo Aware- Price MTBF Dec.31 Budget ness $44.00 22000 1.46 $1,500 98% $44.00 22000 1.04 $1,500 67% $45.00 22000 1.21 $1,450 75% $42.35 22400 1.20 $1,350 68% $43.00 19000 1.65 $1,300 92% $44.50 22000 0.47 $1,500 61% $37.20 20000 1.01 $1,025 54% $34.00 19000 2.30 $1,450 $33.00 19900 3.33 $1,300 93% $29.50 16500 1.80 $1,000 50% $33.40 19800 2.36 $1,350 88% Cust. Sales Access- Budget ibility $1,500 67% $1,500 67% $1,450 73% $1,350 64% $1,300 86% $1,500 86% $1,150 45% $1,450 $2,000 86% $1,000 39% $1,350 64% Dec. Cust. Survey 37 33 31 27 27 42 14 11 5 5 7 95% 73% Using Foundation data from round 4, use your company annual report to identify your situational priorities. Specifically, identify the products which are priority #1 and #2. Be specific in explaining the cause(s) (i.e., identify specific price, costs, product attribute such as position cost, labor cost, etc.). Lastly, explain what you are going to do to improve product profitability. (1) Identified 2 products as situational priorities, for each: (2) identifies at least two causes of low profitability, (3) uses appropriate metrics to quantify the causes, provides appropriate context and comparison, (4) presents a plan for improvement which is consistent with business-level strategy and the cause of low profit, and (5) uses at least one trend and forecasted value to identify 1. Unit Aspects if an acceptable contribution margin, but low profit 2. WTA/ Cost Aspects look at these first if you are using a cost advantage strategy 3. WTP / Demand Aspects look at these first if you are using a benefit advantage strategy 1. Situational Priority #1 is: 1.A. Cause of the product low performance is: 1.B The plan to improve profitability consistent with our business-level strategy is: Digby Erie Low Tech Customer Buying Criteria Expectations Importance 1. Price $15.00 - 35.00 41% 2. Age Ideal Age = 3.0 29% 3. Reliability MTBF 14000-20000 21% 4. Ideal Position Pfmn 6.8 Size 13.2 9% Ferris 0% 20% 40% 60% 80% 100% Perceptual Map for Low Tech Segment Perceptual map (at end of this year) Actual vs Potential Market Share 2024 F122472_022 Low Tech 25% 20% Carigar EasPaze 15% 10% 5% 0% O Actual Potential Performand 16 18 19 20 Top Products in Low Tech Segment Units Market Sold to Name Share Seg Able 23% 1,711 Cake 18% 1,346 Baker 16% 1,211 Daze 15% 1,103 Eat 13% 935 East 8% 592 Cent 5% 361 A2 1% 70 Bold 1% 47 Feast 0% 4 Revision Date 1/15/2024 7/28/2023 5/25/2024 6/14/2024 5/27/2024 1/8/2024 8/15/2024 5/13/2024 7/24/2024 7/9/2024 Stock Pfmn Size Out Coord Coord 6.5 13.5 5.8 13.4 7.0 13.6 7.2 13.0 6.9 13.5 6.2 12.8 7.3 11.3 9.4 10.6 8.8 10.1 9.6 10.2 Cust. List Age Promo Aware- Price MTBF Dec.31 Budget ness $33.00 19900 3.33 $1,300 93% $25.20 17000 3.34 $1,025 63% $33.40 19800 2.36 $1,350 88% $34.00 19000 2.30 $1,450 95% $27.60 16500 1.98 $1,000 57% $29.50 16500 1.80 $1,000 50% $37.20 20000 1.01 $1,025 54% $43.00 19000 1.65 $1,300 92% $42.35 22400 1.20 $1,350 68% $44.00 22000 1.04 $1,500 67% Cust. Sales Access- Budget ibility $2,000 72% $1,150 51% $1,350 48% $1,450 45% $1,000 47% $1,000 47% $1,150 51% $1,300 72% $1,350 48% $1,500 13% Dec. Cust. Survey 37 28 27 24 20 15 8 1 1 0 Erie High Tech Customer Buying Criteria Expectations Importance 1. Ideal Position Pfmn 10.2 Size 9.8 33% 2. Age Ideal Age = 0.0 29% 3. Price $25.00 - 45.00 25% 4. Reliability MTBF 17000-23000 13% Ferris 0% 20% 40% 60% 80% 100% Perceptual Map for High Tech Segment Perceptual map (at end of this year) Actual vs Potential Market Share 2024 F122472_022 High Tech 30% 25% 20% Cent 15% lu 10% 5% 0% 0 Actual Potential 10 12 Performand 16 17 18 19 20 14 Top Products in High Tech Segment Stock Seg Units Market Sold to Name Share Fast 15% 688 Feast 15% 650 Dabble 14% 627 Bold 12% 525 A2 11% 501 A3 7% 299 Cent 6% 270 Daze 4% 190 Able 4% 174 East 4% 172 Baker 4% 162 Revision Date Out 7/9/2024 7/9/2024 6/28/2024 7/24/2024 5/13/2024 7/8/2024 YES 8/15/2024 6/14/2024 1/15/2024 1/8/2024 5/25/2024 Pfmn Size Coord Coord 10.0 9.7 9.6 10.2 9.7 10.6 8.8 10.1 9.4 10.6 9.8 10.2 7.3 11.3 7.2 13.0 6.5 13.5 6.2 12.8 7.0 13.6 Cust. List Age Promo Aware- Price MTBF Dec.31 Budget ness $44.00 22000 1.46 $1,500 98% $44.00 22000 1.04 $1,500 67% $45.00 22000 1.21 $1,450 75% $42.35 22400 1.20 $1,350 68% $43.00 19000 1.65 $1,300 92% $44.50 22000 0.47 $1,500 61% $37.20 20000 1.01 $1,025 54% $34.00 19000 2.30 $1,450 $33.00 19900 3.33 $1,300 93% $29.50 16500 1.80 $1,000 50% $33.40 19800 2.36 $1,350 88% Cust. Sales Access- Budget ibility $1,500 67% $1,500 67% $1,450 73% $1,350 64% $1,300 86% $1,500 86% $1,150 45% $1,450 $2,000 86% $1,000 39% $1,350 64% Dec. Cust. Survey 37 33 31 27 27 42 14 11 5 5 7 95% 73%
Step by Step Solution
There are 3 Steps involved in it

Get step-by-step solutions from verified subject matter experts