

Question: 3. Changes in the money supply The following graph represents the money market for some hypothetical economy. This economy is similar to the United States
3. Changes in the money supply
The following graph represents the money market for some hypothetical economy. This economy is similar to the United States in the sense that it has a central bank called the Fed, but a major difference is that this economy is closed (and therefore does not have any interaction with other world economies). The money market is currently in equilibrium at an interest rate of 6% and a quantity of money equal to $0.4 trillion, designated on the graph by the grey star symbol.
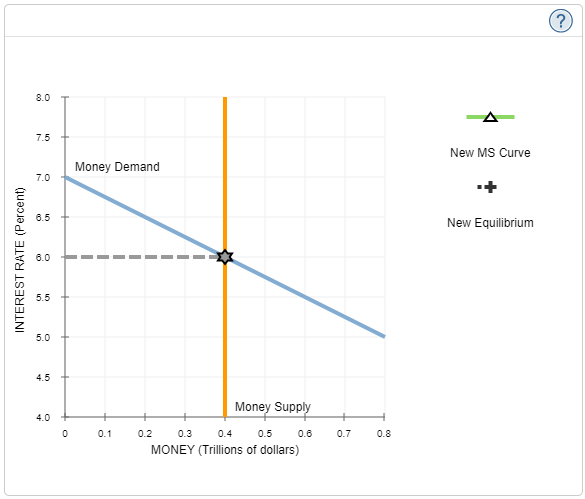
8.0 A 7.5 New MS Curve Money Demand 7.0 6.5 New Equilibrium 6.0 INTEREST RATE (Percent) 5.5 5.0 45 Money Supply 4.0 0 0.1 0.2 0.3 0.4 0.5 0.6 0.7 0.8 MONEY (Trillions of dollars)O Aggregate Demand PRICE LEVEL Aggregate Demand OUTPUT
Step by Step Solution
There are 3 Steps involved in it

Get step-by-step solutions from verified subject matter experts