

Question: 3. (CLO 2) Test a claim that the mean height of your population is different from 64 inches. Use a significance level of 0.02. a.
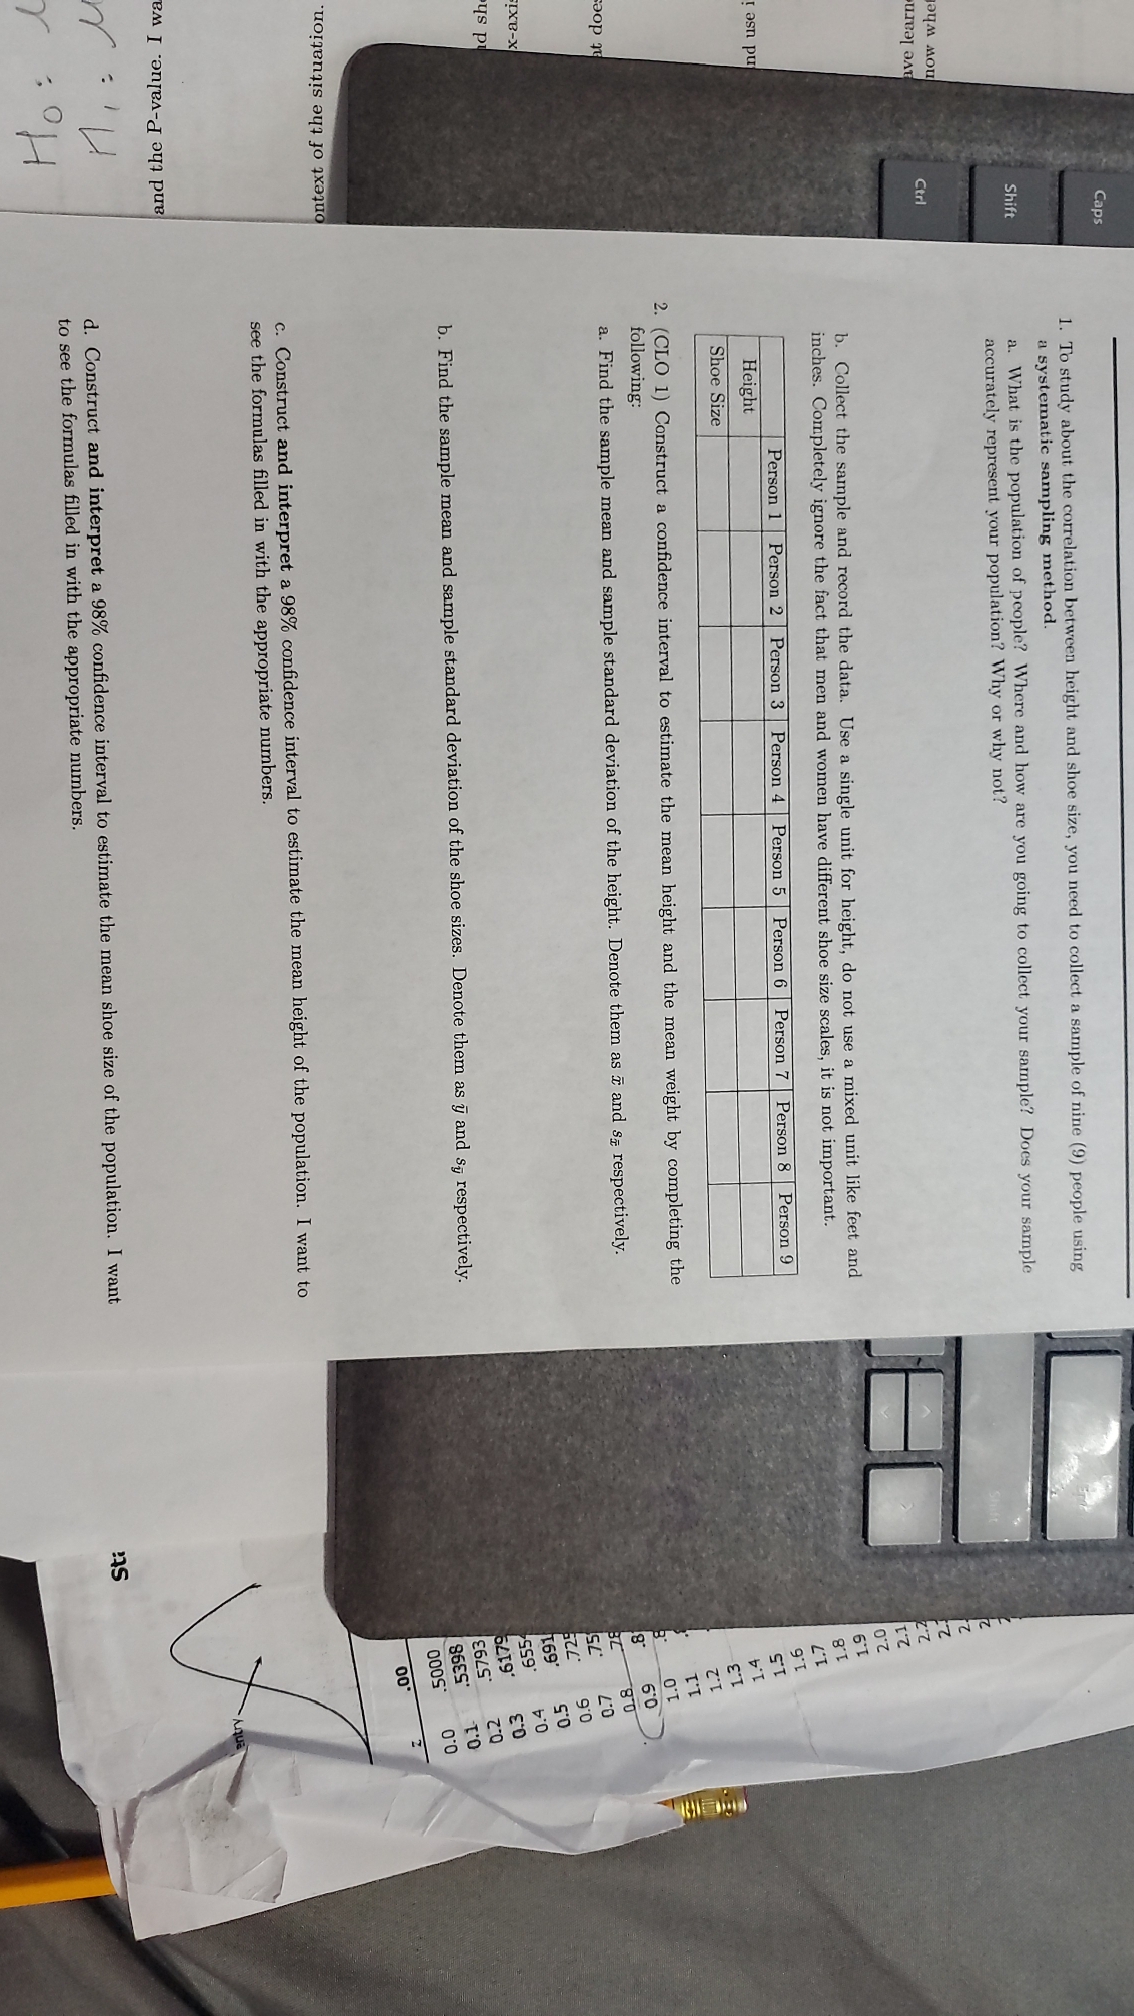
3. (CLO 2) Test a claim that the mean height of your population is different from 64 inches. Use a significance level of 0.02. a. State the initial and alternative hypothesis. b. Find the test statistic and the P-value. I want to see the formulas filled in with the numbers. c. Draw a conclusion in context of the situation. 4. (CLO 3) Find a correlation between height and shoe size. a. Create a scatterplot of the data. Height is x-axis and Shoe size is y-axis. Attach your scatterplot to the end of this document. b. Find the linear correlation coefficient. What does this tell you about your data? C. Write the equation of the regression line and use it to predict the shoe size of a person that is 68 inches tall. 3. Write a paragraph or two about what you have learned from this process. When you read, see, or hear a statistic in the future, what skills will you apply to know whether you can trust the result?Caps 1. To study about the correlation between height and shoe size, you need to collect a sample of nine (9) people using a systematic sampling method. Shift a. What is the population of people? Where and how are you going to collect your sample? Does your sample accurately represent your population? Why or why not ? now whe ave learn Strl INNNNNN ! b. Collect the sample and record the data. Use a single unit for height, do not use a mixed unit like feet and inches. Completely ignore the fact that men and women have different shoe size scales, it is not important. nd use i Height Person 1 Person 2 Person 3 Person 4 |Person 5 Person 6 Person 7 Person 8 Person 9 in : Shoe Size 2. (CLO 1) Construct a confidence interval to estimate the mean height and the mean weight by completing the following: 1.0 at does a. Find the sample mean and sample standard deviation of the height. Denote them as i and $1 respectively. 60 80 .75 L'0 90 x-axis 169 ' 0.5 0.4 us p s59' 6419' 0.3 b. Find the sample mean and sample standard deviation of the shoe sizes. Denote them as y and sy respectively. .5793 0.2 .5398 TO .5000 0'0 00 ontext of the situation. c. Construct and interpret a 98% confidence interval to estimate the mean height of the population. I want to see the formulas filled in with the appropriate numbers. and the P-value. I wa 7 : ' d. Construct and interpret a 98% confidence interval to estimate the mean shoe size of the population. I want Ho : I to see the formulas filled in with the appropriate numbers
Step by Step Solution
There are 3 Steps involved in it

Get step-by-step solutions from verified subject matter experts