

Question: 3. Cluster Analysis (Chapter 15) A small data set of ocean temperature measurements from an eight-hour period (1:00 pm to 9:00 pm) is shown below.
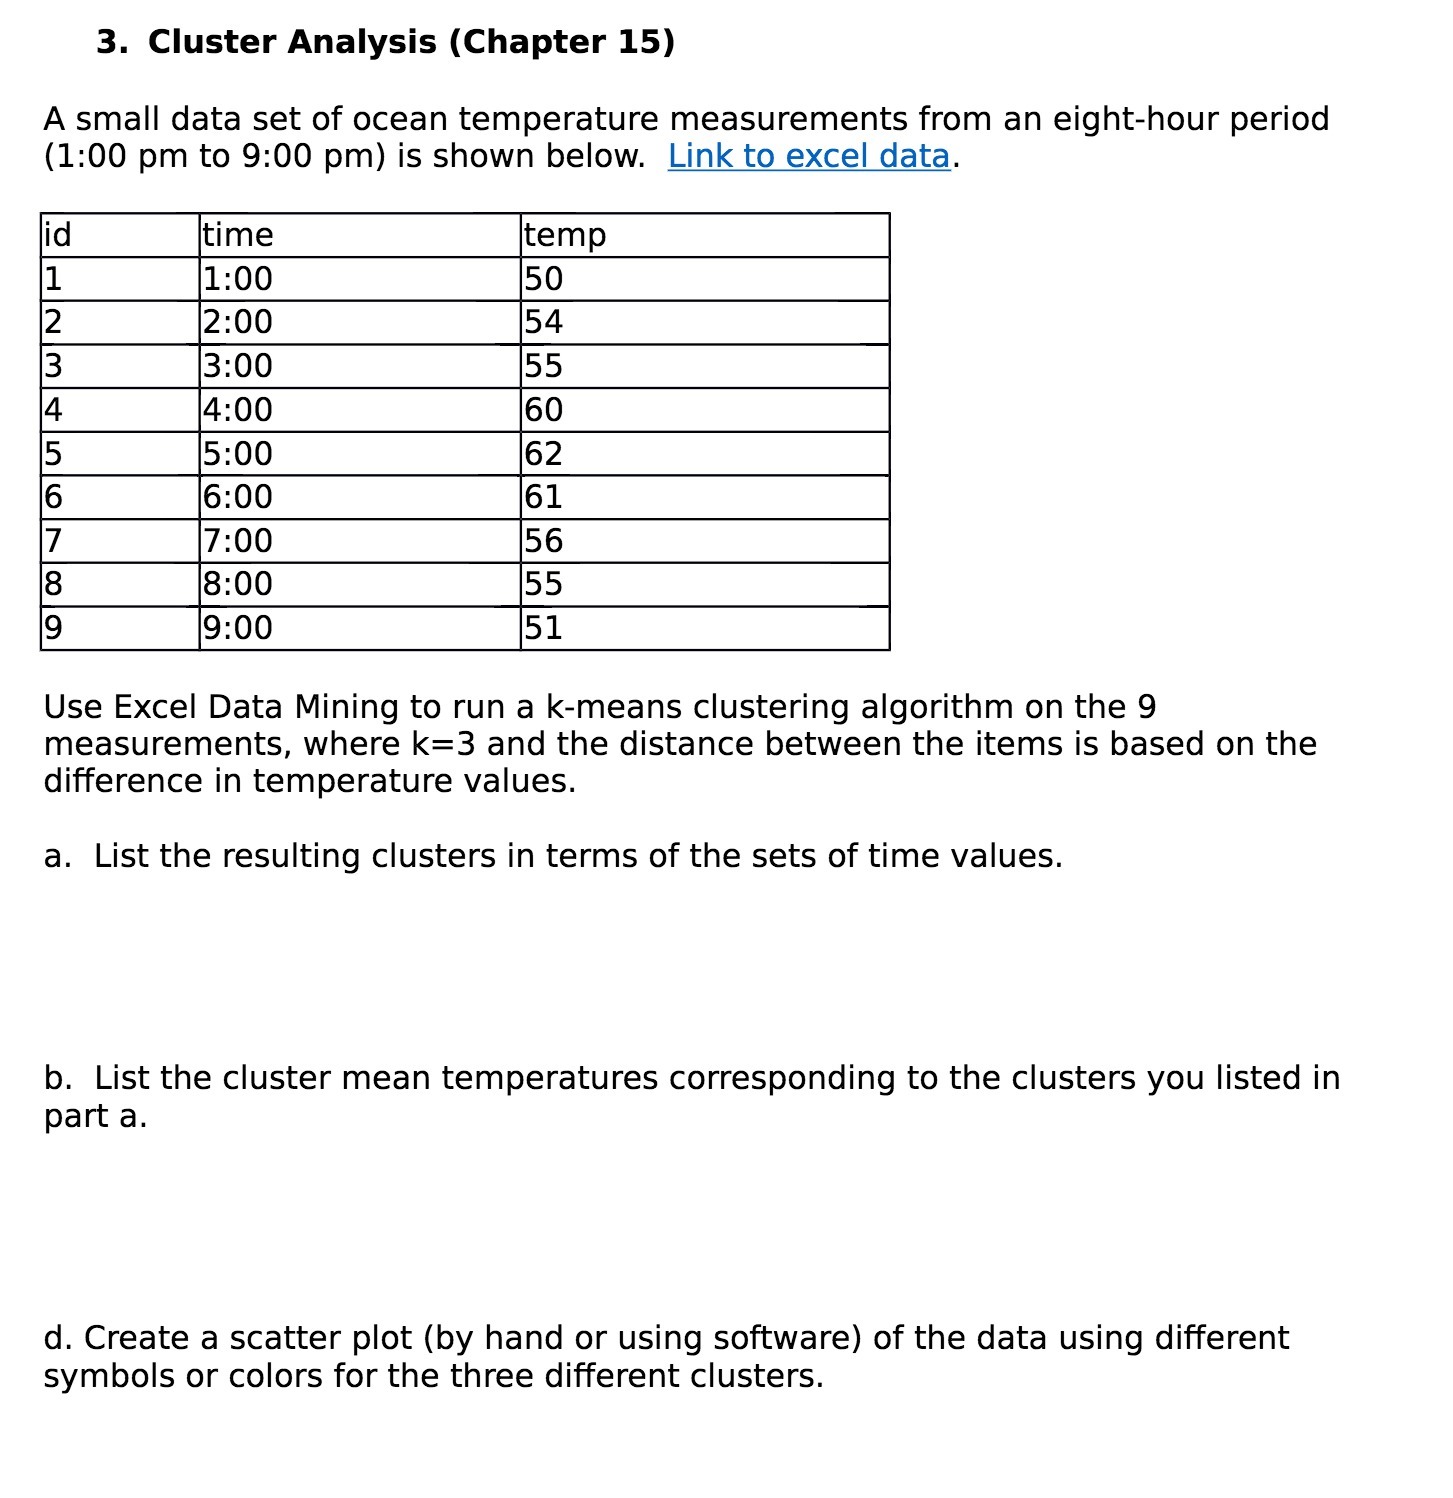
3. Cluster Analysis (Chapter 15) A small data set of ocean temperature measurements from an eight-hour period (1:00 pm to 9:00 pm) is shown below. Link to excel data. Use Excel Data Mining to run a k-means clustering algorithm on the 9 measurements. where k=3 and the distance between the items is based on the difference in temperature values. a. List the resulting clusters in terms of the sets of time values. b. List the cluster mean temperatures corresponding to the clusters you listed in part a. d. Create a scatter plot (by hand or using software) of the data using different symbols or colors for the three different clusters
Step by Step Solution
There are 3 Steps involved in it
1 Expert Approved Answer
Step: 1 Unlock

Question Has Been Solved by an Expert!
Get step-by-step solutions from verified subject matter experts
Step: 2 Unlock
Step: 3 Unlock