

Question: 3. Complete the following chart Compute variances for the items shown in the following list and indicate whether each variance is favorable (F) or unfavorable
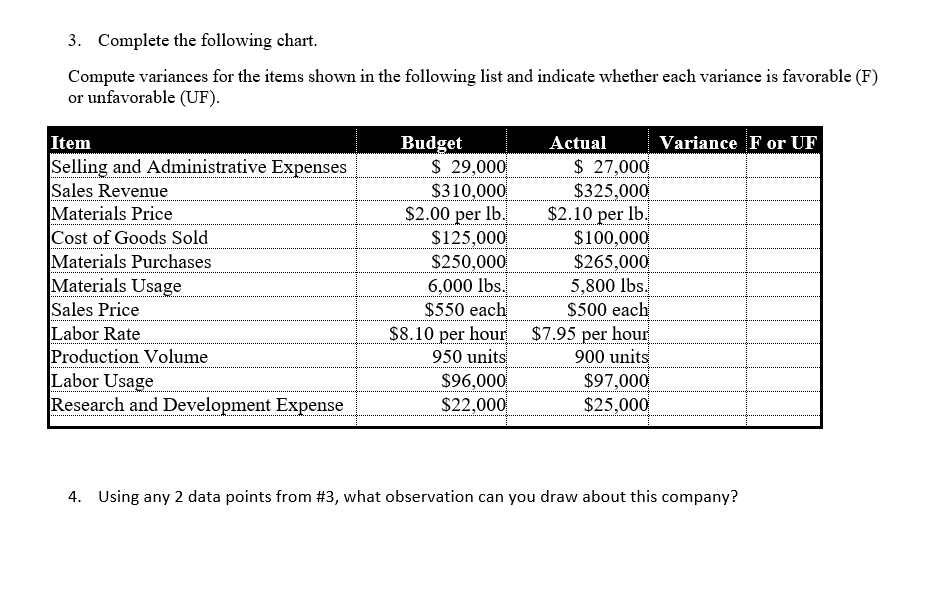
3. Complete the following chart Compute variances for the items shown in the following list and indicate whether each variance is favorable (F) or unfavorable (UF) Budget Actual Variance F or UF Item Selling and Administrative Expenses Sales Revenue Materials Price Cost of Goods Sold Materials Purchases Materials Usage Sales Price Labor Rate Production Volume Labor Usage Research and Development Expense S 29,000 S310,000 $ 27,000 $325,00 $2.10 per Ib $100,000 $265,00 5,800 lbs. S500 eac $8.10 per hour$7.95 per hour 900 units $97,00 $25,00 $2.00 per Ib S125,00 $250,000 6,000 lbs. $550 each 950 units $96,000 $22,000 4. using any 2 data points from #3, what observation can you draw about this company
Step by Step Solution
There are 3 Steps involved in it

Get step-by-step solutions from verified subject matter experts