

Question: 3. Compute the sample correlation coefficient, showing the relationship between Satisfaction Level and each of the other three variables (Shift A Average Call time, Shift
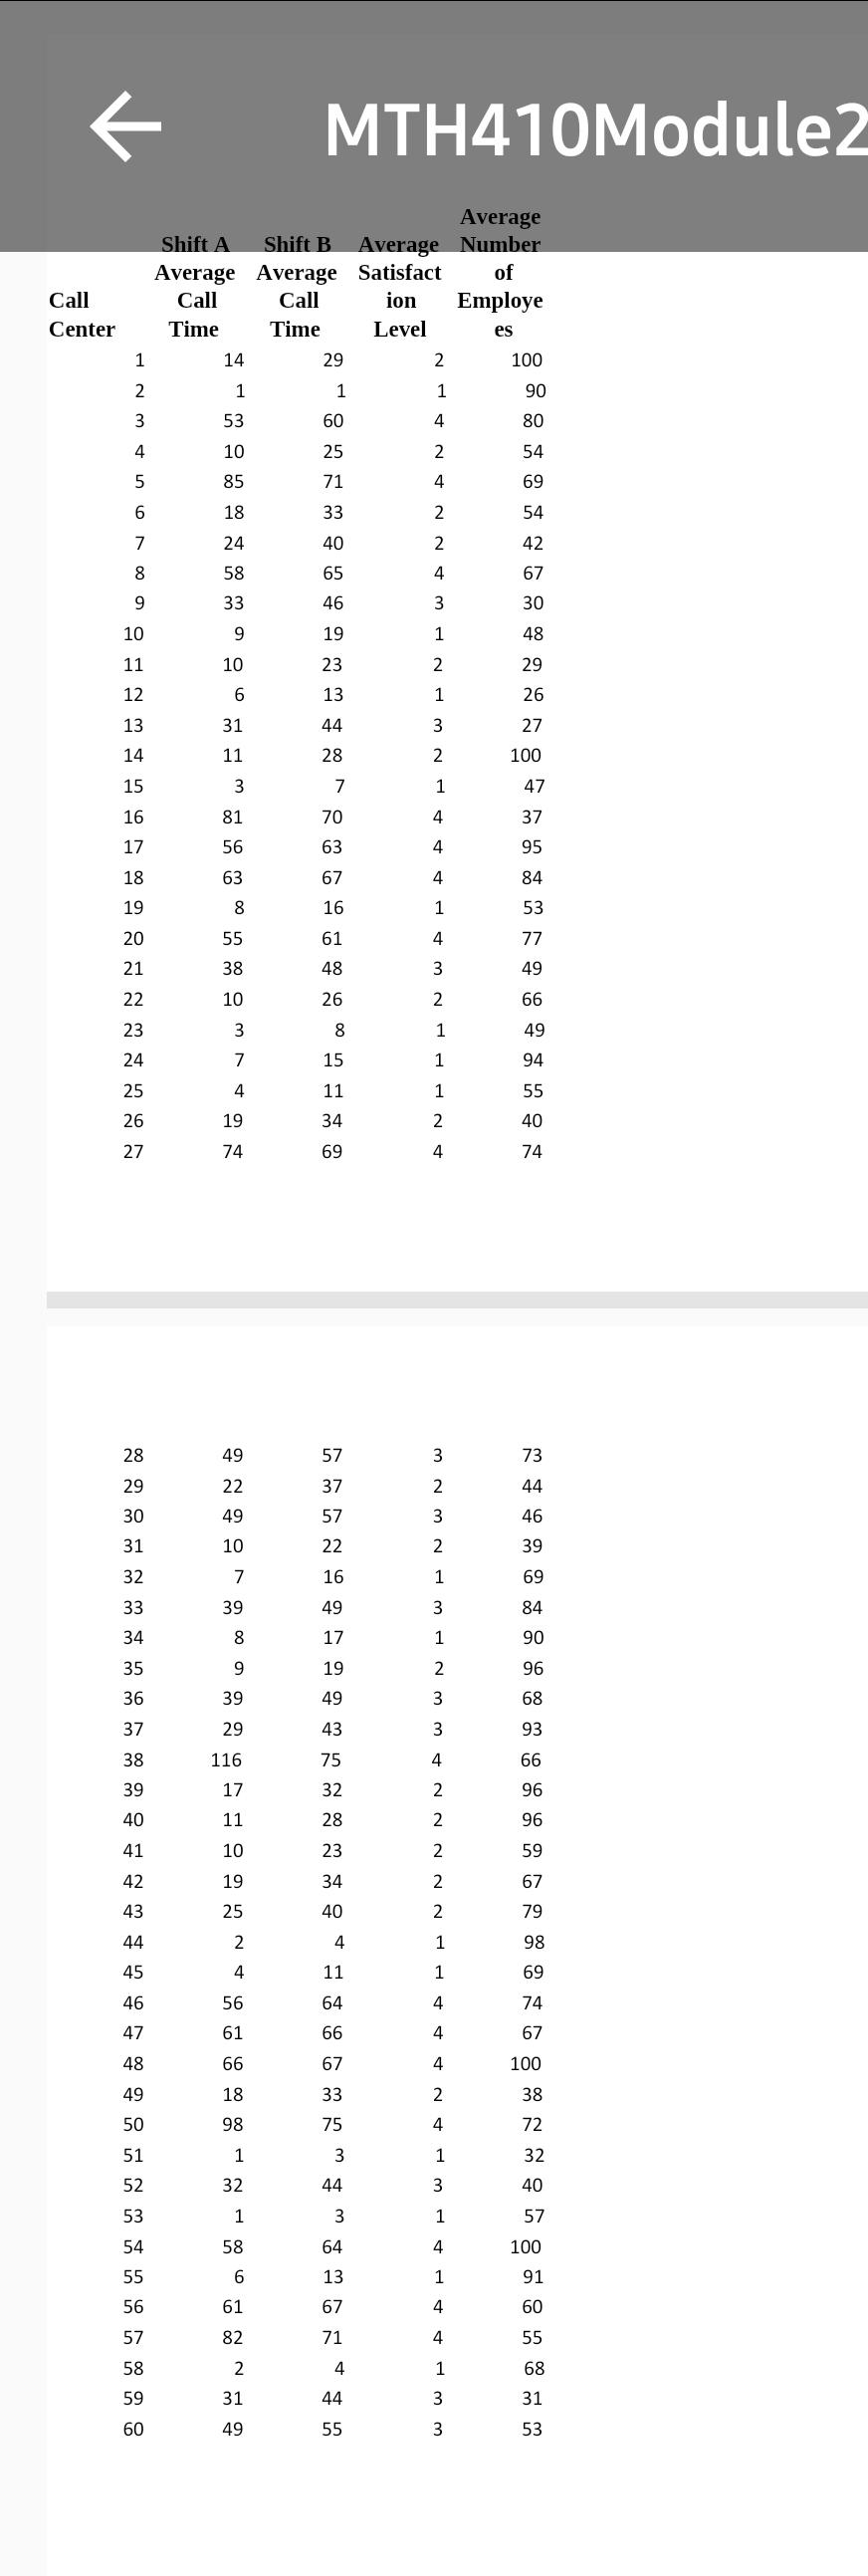
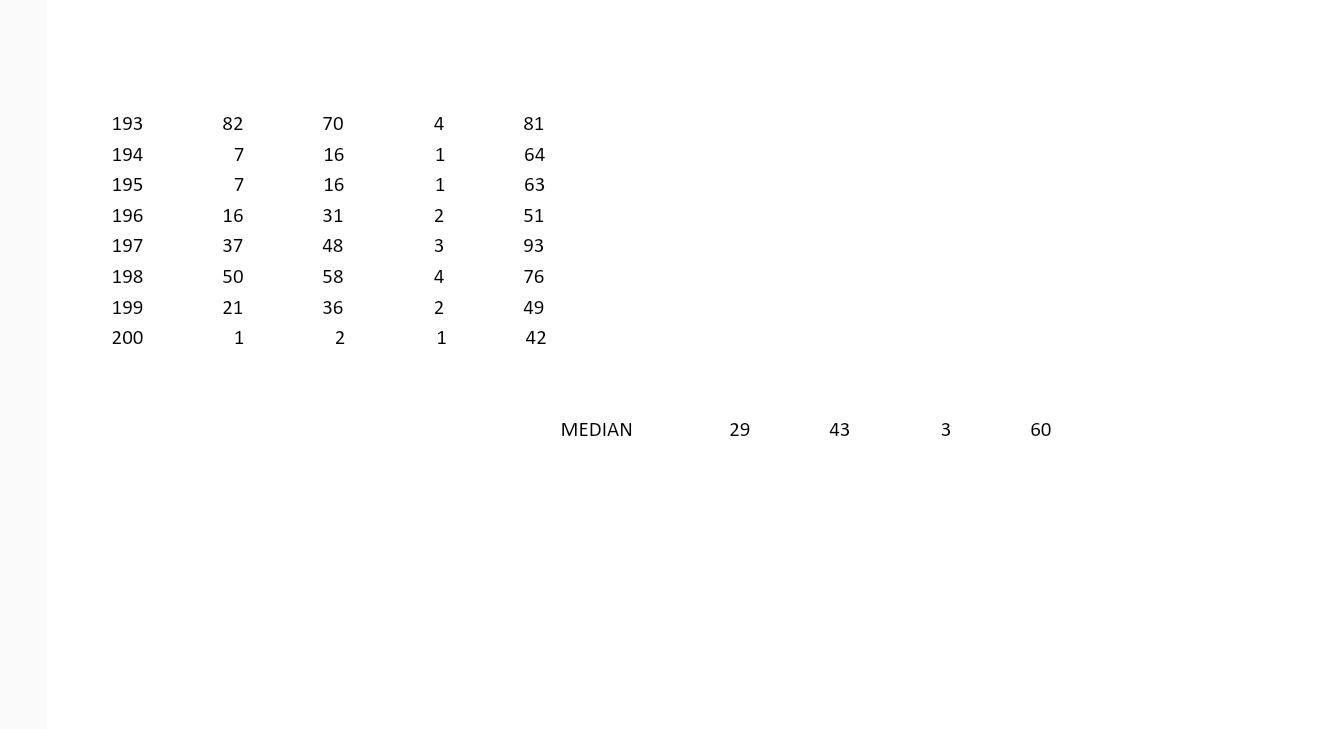 3. Compute the sample correlation coefficient, showing the relationship between Satisfaction Level and each of the other three variables (Shift A Average Call time, Shift B Average Call Time, Average Number of Employees). o Explain what the correlation coefficients tell us about the three pairs of relationships. Use tables, charts, or graphs to support your conclusions. Submit your Excel file in addition to your report.
Step by Step Solution
There are 3 Steps involved in it
1 Expert Approved Answer
Step: 1 Unlock

Question Has Been Solved by an Expert!
Get step-by-step solutions from verified subject matter experts
Step: 2 Unlock
Step: 3 Unlock