

Question: 3. Compute the summary statistics below for the Pittsburgh Pirates in Excel. The cells in which you will compute these statistics are highlighted in yellow.
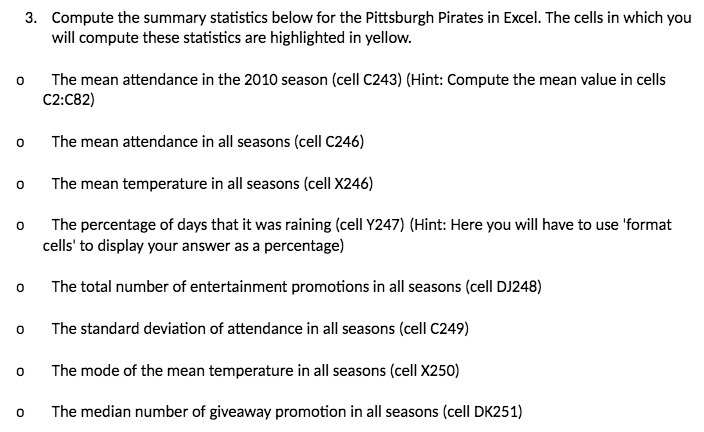
3. Compute the summary statistics below for the Pittsburgh Pirates in Excel. The cells in which you will compute these statistics are highlighted in yellow. O The mean attendance in the 2010 season (cell C243) (Hint: Compute the mean value in cells C2:C82) 0 The mean attendance in all seasons (cell C246) o The mean temperature in all seasons (cell X246) o The percentage of days that it was raining (cell Y247) (Hint: Here you will have to use 'format cells' to display your answer as a percentage) o The total number of entertainment promotions in all seasons (cell DJ248) o The standard deviation of attendance in all seasons (cell C249) o The mode of the mean temperature in all seasons (cell X250) o The median number of giveaway promotion in all seasons (cell DK251)
Step by Step Solution
There are 3 Steps involved in it

Get step-by-step solutions from verified subject matter experts