

Question: 3. Consider Table 3 Table 3 Stock Expected Return 10% 5% Standard Deviation 12% 8% Correlation Coefficient 0.40 (a) Consider Table 3. Compute the expected
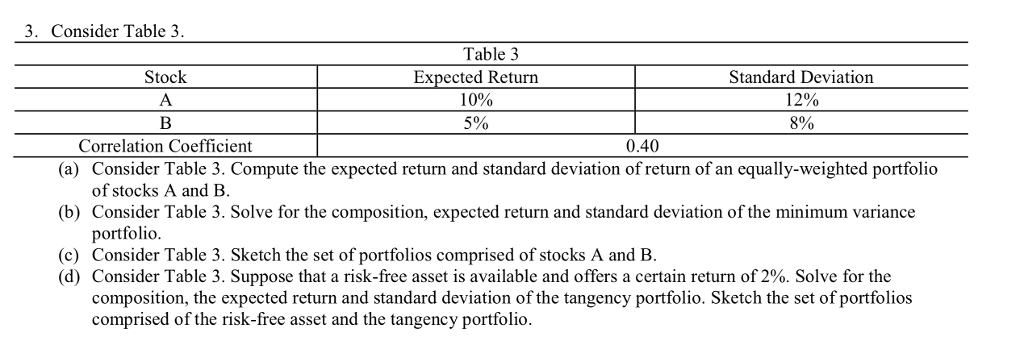
3. Consider Table 3 Table 3 Stock Expected Return 10% 5% Standard Deviation 12% 8% Correlation Coefficient 0.40 (a) Consider Table 3. Compute the expected return and standard deviation of return of an equally-weighted portfolio of stocks A and B (b) Consider Table 3. Solve for the composition, expected return and standard deviation of the minimum variance portfolio (c) Consider Table 3. Sketch the set of portfolios comprised of stocks A and B (d) Consider Table 3. Suppose that a risk-free asset is available and offers a certain return of 2%. Solve for the composition, the expected return and standard deviation of the tangency portfolio. Sketch the set of portfolios comprised of the risk-free asset and the tangency portfolio
Step by Step Solution
There are 3 Steps involved in it

Get step-by-step solutions from verified subject matter experts