

Question: 3. Consider Table 4 and the information provided therein for stocks 1 and 2. Stock 1 Stock 2 Correlation (Stock 1, 2) Table 4
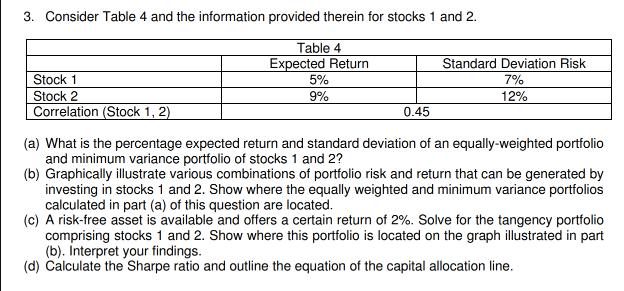
3. Consider Table 4 and the information provided therein for stocks 1 and 2. Stock 1 Stock 2 Correlation (Stock 1, 2) Table 4 Expected Return 5% 9% 0.45 Standard Deviation Risk 7% 12% (a) What is the percentage expected return and standard deviation of an equally-weighted portfolio and minimum variance portfolio of stocks 1 and 2? (b) Graphically illustrate various combinations of portfolio risk and return that can be generated by investing in stocks 1 and 2. Show where the equally weighted and minimum variance portfolios calculated in part (a) of this question are located. (c) A risk-free asset is available and offers a certain return of 2%. Solve for the tangency portfolio comprising stocks 1 and 2. Show where this portfolio is located on the graph illustrated in part (b). Interpret your findings. (d) Calculate the Sharpe ratio and outline the equation of the capital allocation line.
Step by Step Solution
There are 3 Steps involved in it

Get step-by-step solutions from verified subject matter experts