

Question: 3. Consider the cause-effect graph shown in Figure 1 that exhibits the relationship between several causes and effect E. (1)Derive a test set T
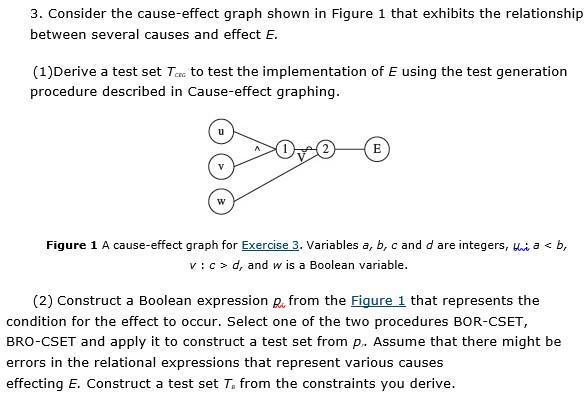
3. Consider the cause-effect graph shown in Figure 1 that exhibits the relationship between several causes and effect E. (1)Derive a test set T to test the implementation of E using the test generation procedure described in Cause-effect graphing. W E Figure 1 A cause-effect graph for Exercise 3. Variables a, b, c and d are integers, thi a < b, v: cd, and w is a Boolean variable. (2) Construct a Boolean expression p from the Figure 1 that represents the condition for the effect to occur. Select one of the two procedures BOR-CSET, BRO-CSET and apply it to construct a test set from p. Assume that there might be errors in the relational expressions that represent various causes effecting E. Construct a test set T, from the constraints you derive.
Step by Step Solution
There are 3 Steps involved in it

Get step-by-step solutions from verified subject matter experts