

Question: 3. Consider the following plot for TCP window size as a function of time. Some of the data points are indicated by the bullets below.
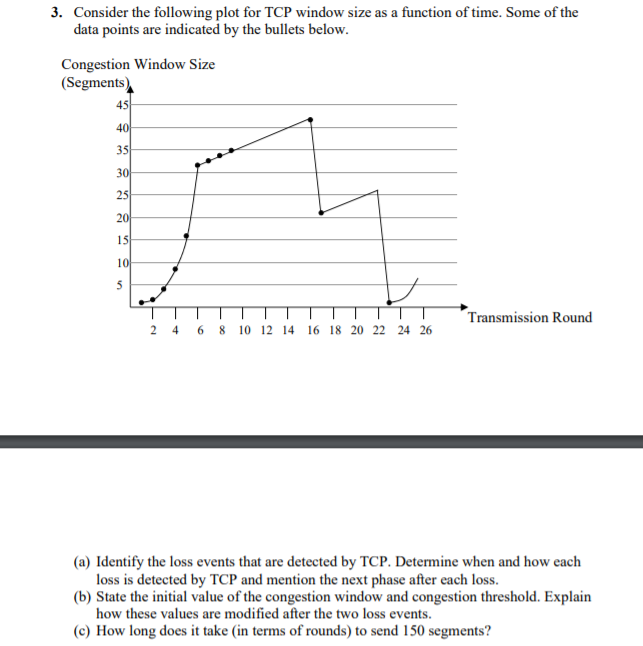
3. Consider the following plot for TCP window size as a function of time. Some of the data points are indicated by the bullets below. Congestion Window Size (Segments) 45 21 35 S1 1.5 110 Transmission Round 2 4 6 8 10 12 14 16 18 20 22 24 26 (a) Identify the loss events that are detected by TCP. Determine when and how each loss is detected by TCP and mention the next phase after each loss. (b) State the initial value of the congestion window and congestion threshold. Explain how these values are modified after the two loss events. (c) How long does it take (in terms of rounds) to send 150 segments
Step by Step Solution
There are 3 Steps involved in it
1 Expert Approved Answer
Step: 1 Unlock

Question Has Been Solved by an Expert!
Get step-by-step solutions from verified subject matter experts
Step: 2 Unlock
Step: 3 Unlock