

Question: 3. Consider the following SAS output with missing values patterns: Missing Data Patterns Group Means Group y x1 X7 X3 x4 X5 x6 Freq Percent

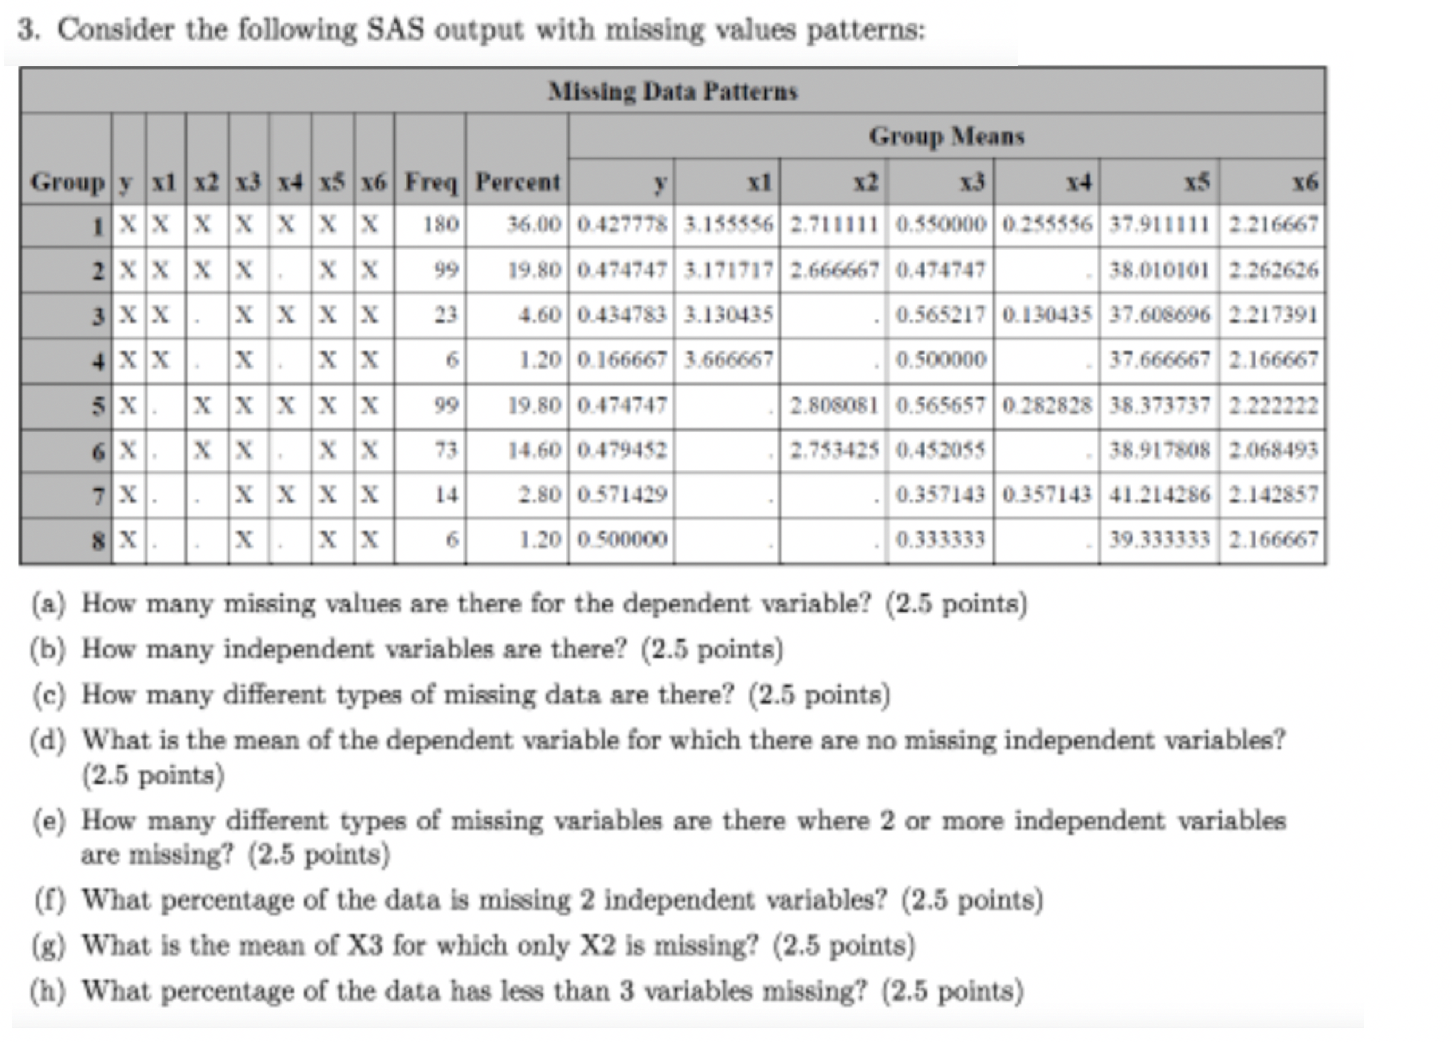
3. Consider the following SAS output with missing values patterns: Missing Data Patterns Group Means Group y x1 X7 X3 x4 X5 x6 Freq Percent x1 x2 14 X5 X6 XIX X X X X 180 36.00 0.427778 3.153536 2.718111 0.530000 0.235356 37.911111 2.216667 X X X X X X 19.80 0474747 3.171717 2.666567 0.474747 38.010101 2.262626 XX X X X X 23 4.60 0.434783 3.130435 0.565217 0.130435 37.608696 2.217391 X X X X X 1.20 0.166667 3.666657 0.500000 37.666667 2.166667 S X X X X X X 90 19.80 0.474747 2.808081 0.565657 0.282828 38.373737 2.222222 X X X 73 14.60 0.479452 2.753425 0.452055 38.917808 2.068493 X X X X X 14 2.80 0571429 0.357143 0.357143 41.214286 2.142857 X X X 1.20 0 500000 0.333333 39.333333 2.166667 (a) How many missing values are there for the dependent variable? (2.5 points) (b) How many independent variables are there? (2.5 points) (c) How many different types of missing data are there? (2.5 points) (d) What is the mean of the dependent variable for which there are no missing independent variables? (2.5 points) (e) How many different types of missing variables are there where 2 or more independent variables are missing? (2.5 points) (f) What percentage of the data is missing 2 independent variables? (2.5 points) (g) What is the mean of X3 for which only X2 is missing? (2.5 points) (h) What percentage of the data has less than 3 variables missing? (2.5 points)
Step by Step Solution
There are 3 Steps involved in it

Get step-by-step solutions from verified subject matter experts