

Question: 3. Consider the time series in Table 3, foreign direct investment (FDI) and inflation rate (INF) of Malaysia from 1970 to 2015. Using the Engle-Granger
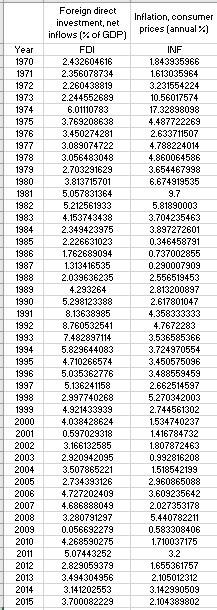
3. Consider the time series in Table 3, foreign direct investment (FDI) and inflation rate (INF) of Malaysia from 1970 to 2015. Using the Engle-Granger (EG) approach, test the two variables. Comment if these two variables are cointegrated. (Use 5% significance level) Inflation, consumer prices (annual) Year 1970 1971 1972 1973 1974 1975 1976 1977 1978 1979 1980 1981 1982 1983 1984 1985 1986 1987 1988 1989 1990 1991 1992 1993 1994 1995 1996 1997 1998 1999 2000 2001 2002 2003 2004 2005 2006 2007 2008 2009 2010 2011 2012 2013 2014 2015 Foreign direct investment, net inflows (% of GDP) FDI 2.432604616 2.356078734 2.260438819 2.244552689 6.01110783 3.769208638 3.450274281 3.089074722 3.056483048 2.703291629 3.813715701 5.057831364 5.212561933 4.153743438 2.349423975 2.226631023 1.762689094 1.313416535 2.039636235 4.293264 5.298123388 8.13638985 8.760532541 7.482897114 5.829644083 4.710266574 5.035362776 5.136241158 2.997740268 4.921433939 4.038428624 0.597029318 3.166132585 2.920942095 3.507865221 2.734393126 4.727202409 4.686888049 3.280791297 0.056692279 4.268590275 5.07443252 2.829059379 3.494304956 3.141202553 3.700082229 INF 1.843935966 1.613035964 3.231554224 10.56017574 17.32898098 4.487722269 2.633711507 4.788224014 4.860064586 3.654467998 6.674919535 9.7 5.81890003 3.704235463 3.897272601 0.346458791 0.737002855 0.290007909 2.556519453 2.813200897 2.617801047 4.358333333 4.7672283 3.536585366 3.724970554 3.450575096 3.488559459 2.662514597 5.270342003 2.744561302 1.534740237 1.416784732 1.807872463 0.992816208 1.518542199 2.960865088 3.609235642 2.027353178 5.440782211 0.583308406 1.710037175 3.2 1.655361757 2.105012312 3.142990509 2.104389802 3. Consider the time series in Table 3, foreign direct investment (FDI) and inflation rate (INF) of Malaysia from 1970 to 2015. Using the Engle-Granger (EG) approach, test the two variables. Comment if these two variables are cointegrated. (Use 5% significance level) Inflation, consumer prices (annual) Year 1970 1971 1972 1973 1974 1975 1976 1977 1978 1979 1980 1981 1982 1983 1984 1985 1986 1987 1988 1989 1990 1991 1992 1993 1994 1995 1996 1997 1998 1999 2000 2001 2002 2003 2004 2005 2006 2007 2008 2009 2010 2011 2012 2013 2014 2015 Foreign direct investment, net inflows (% of GDP) FDI 2.432604616 2.356078734 2.260438819 2.244552689 6.01110783 3.769208638 3.450274281 3.089074722 3.056483048 2.703291629 3.813715701 5.057831364 5.212561933 4.153743438 2.349423975 2.226631023 1.762689094 1.313416535 2.039636235 4.293264 5.298123388 8.13638985 8.760532541 7.482897114 5.829644083 4.710266574 5.035362776 5.136241158 2.997740268 4.921433939 4.038428624 0.597029318 3.166132585 2.920942095 3.507865221 2.734393126 4.727202409 4.686888049 3.280791297 0.056692279 4.268590275 5.07443252 2.829059379 3.494304956 3.141202553 3.700082229 INF 1.843935966 1.613035964 3.231554224 10.56017574 17.32898098 4.487722269 2.633711507 4.788224014 4.860064586 3.654467998 6.674919535 9.7 5.81890003 3.704235463 3.897272601 0.346458791 0.737002855 0.290007909 2.556519453 2.813200897 2.617801047 4.358333333 4.7672283 3.536585366 3.724970554 3.450575096 3.488559459 2.662514597 5.270342003 2.744561302 1.534740237 1.416784732 1.807872463 0.992816208 1.518542199 2.960865088 3.609235642 2.027353178 5.440782211 0.583308406 1.710037175 3.2 1.655361757 2.105012312 3.142990509 2.104389802
Step by Step Solution
There are 3 Steps involved in it

Get step-by-step solutions from verified subject matter experts