

Question: 3. Data were collected from a random sample of 100 student athletes at a large state university. The plot below shows grade point average (GPA)
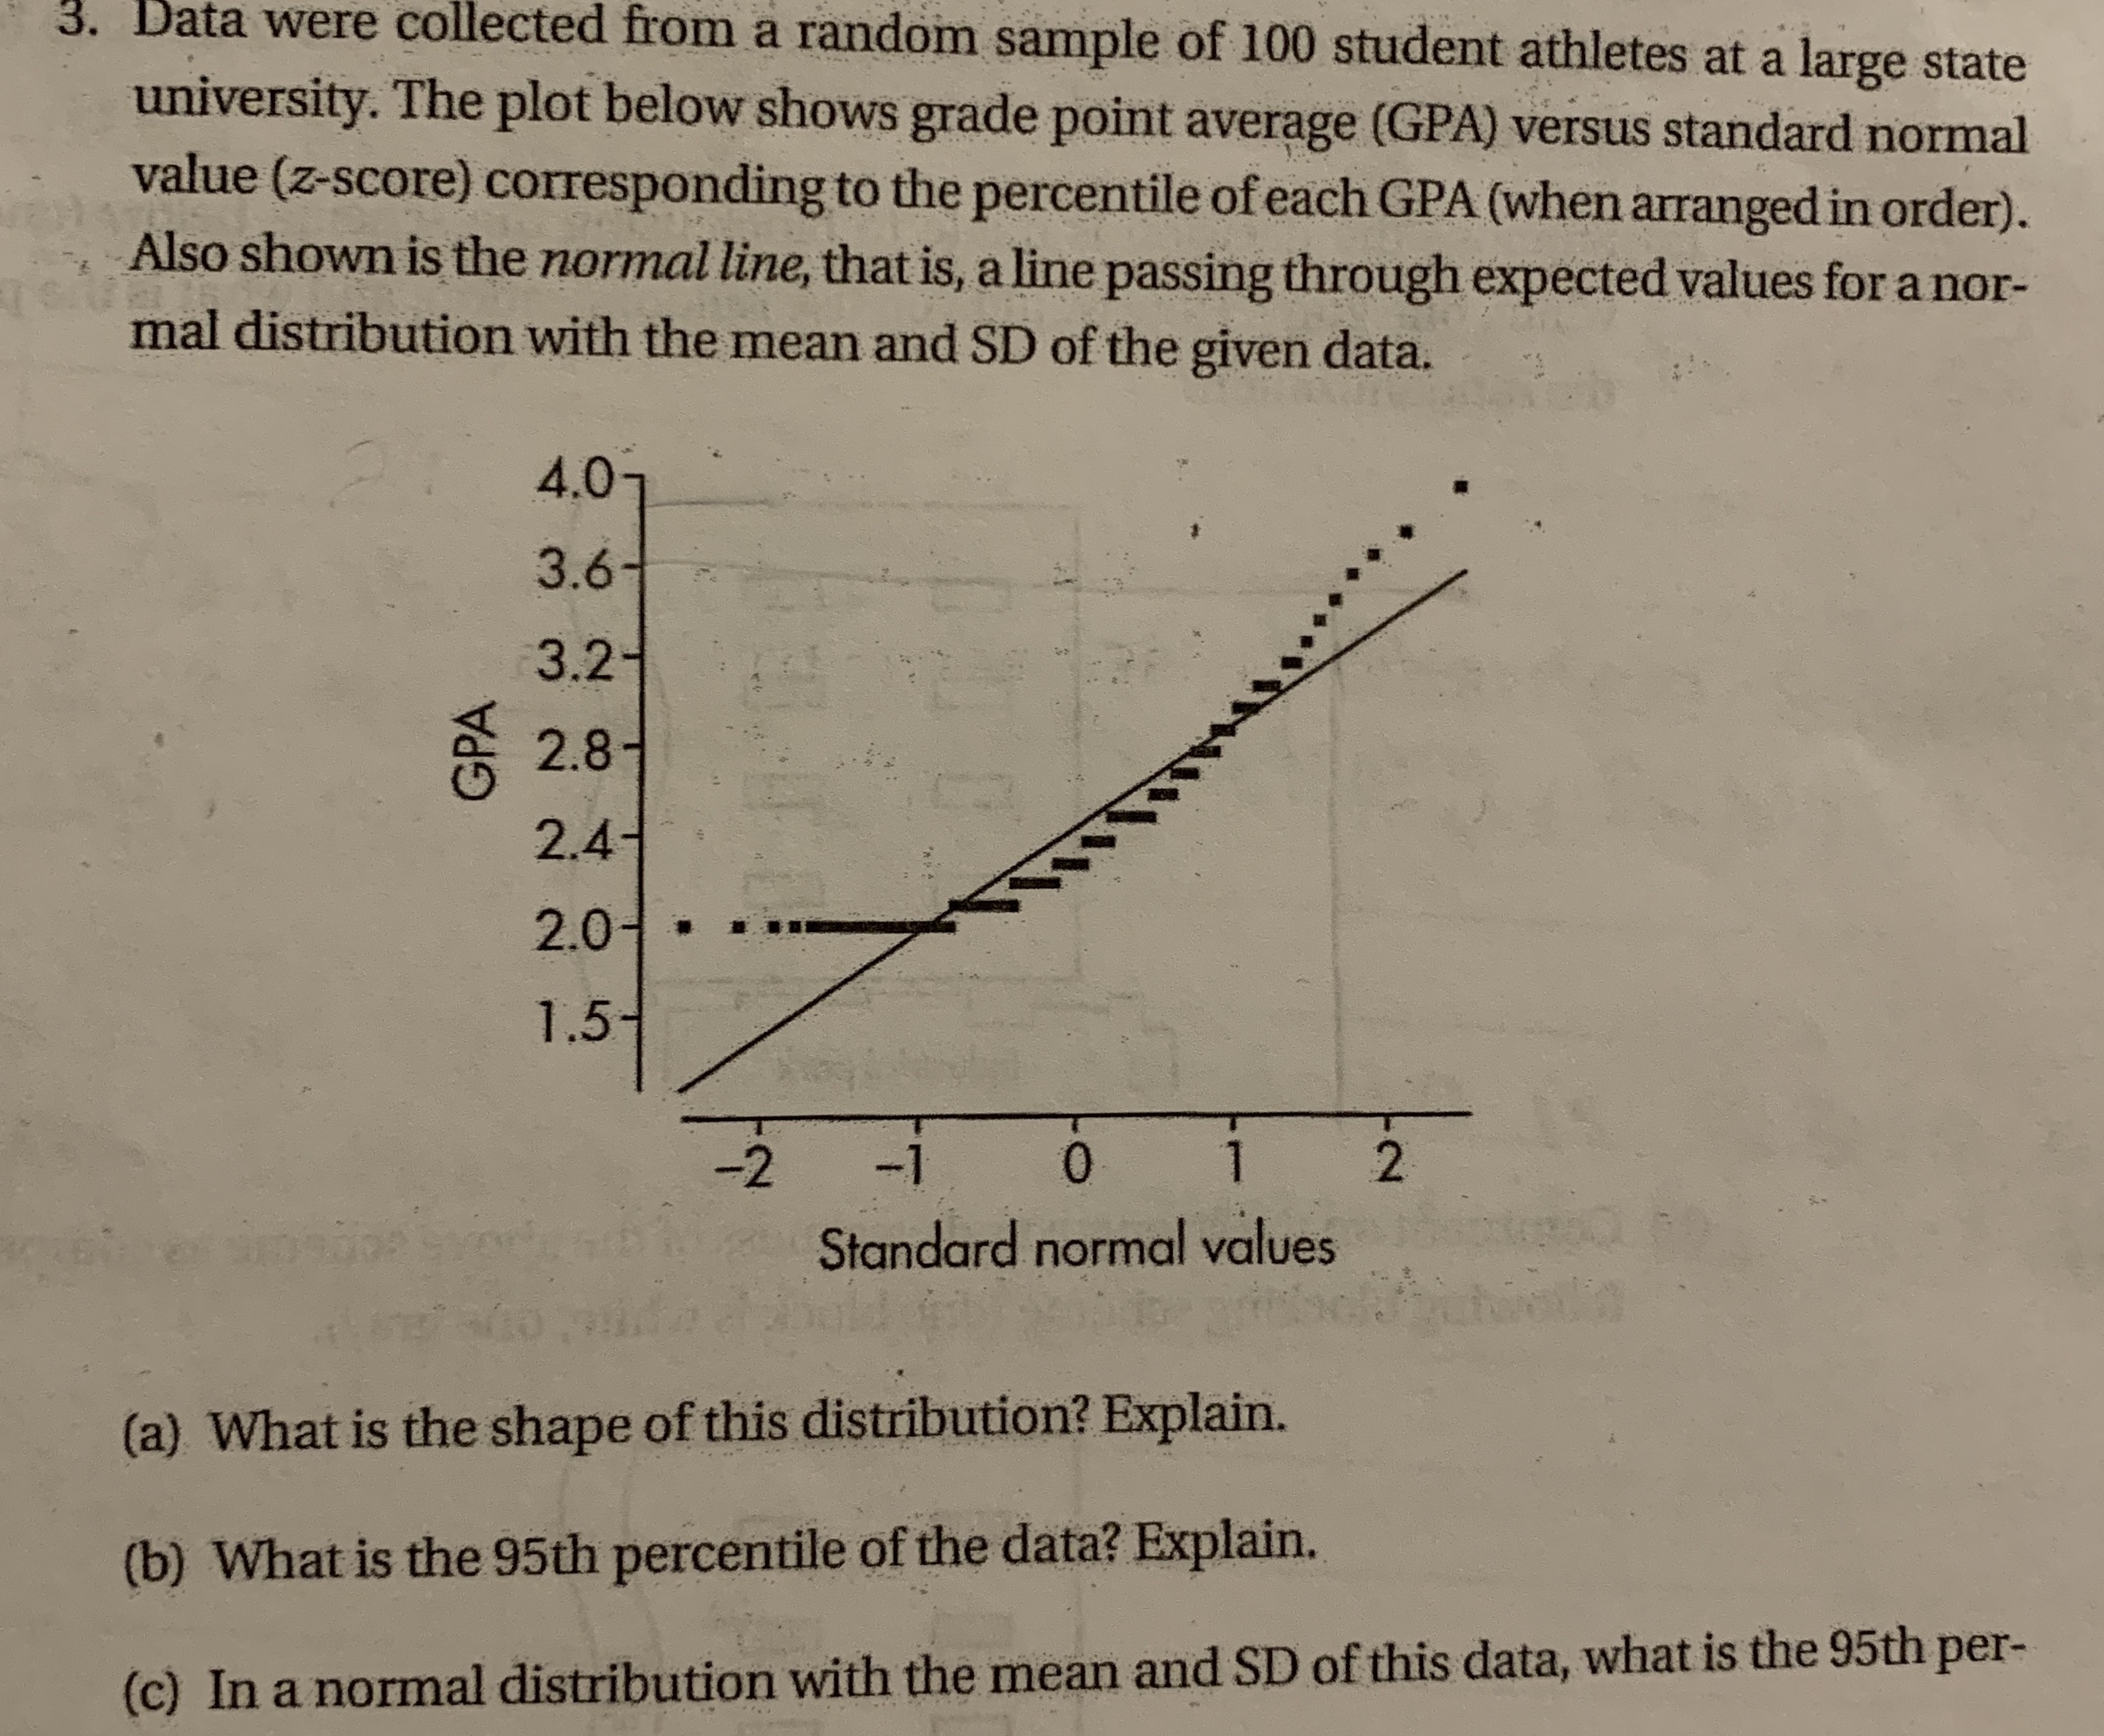
3. Data were collected from a random sample of 100 student athletes at a large state university. The plot below shows grade point average (GPA) versus standard normal value (z-score) corresponding to the percentile of each GPA (when arranged in order). Also shown is the normal line, that is, a line passing through expected values for a nor- mal distribution with the mean and SD of the given data. 4.0- 3.6- 3.2 GPA 2.8 2.41 2.0- . .. 1.5 - 0 2 Standard normal values (a) What is the shape of this distribution? Explain. (b) What is the 95th percentile of the data? Explain. (c) In a normal distribution with the mean and SD of this data, what is the 95th per
Step by Step Solution
There are 3 Steps involved in it

Get step-by-step solutions from verified subject matter experts