

Question: 3. Define a variable y from 0 to 20 with steps of 0.2. Also, define the time variable t from 0 to 10 with
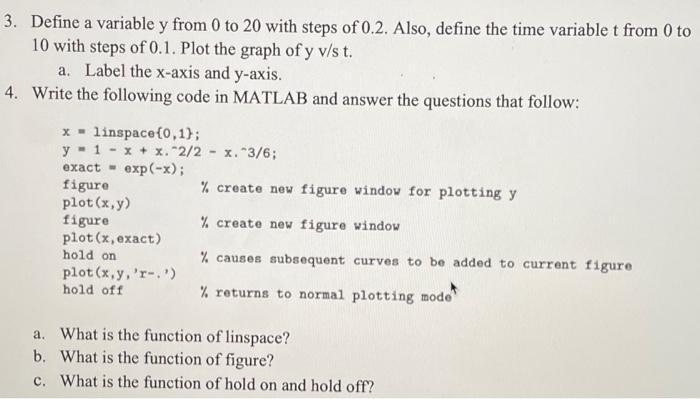
3. Define a variable y from 0 to 20 with steps of 0.2. Also, define the time variable t from 0 to 10 with steps of 0.1. Plot the graph of y v/s t. a. Label the x-axis and y-axis. 4. Write the following code in MATLAB and answer the questions that follow: x linspace(0,1); y 1 x +x. 2/2 - x. 3/6; exact exp(-x); figure plot (x, y) figure plot (x, exact) hold on plot (x,y,'r-.') hold off % create new figure window for plotting y % create new figure window % causes subsequent curves to be added to current figure % returns to normal plotting mode" a. What is the function of linspace? b. What is the function of figure? c. What is the function of hold on and hold off?
Step by Step Solution
There are 3 Steps involved in it
The MATLAB code provided in the image seems to be a set of instructions intended to demonstrate the usage of some basic plotting functions in MATLAB B... View full answer

Get step-by-step solutions from verified subject matter experts