

Question: 3 Describing Data GO pter 0 3 Describing Data Visually destion 4 of 1 5 ( 2 ) Saved A line chart can be used
Describing Data
GO
pter Describing Data Visually
destion of
Saved
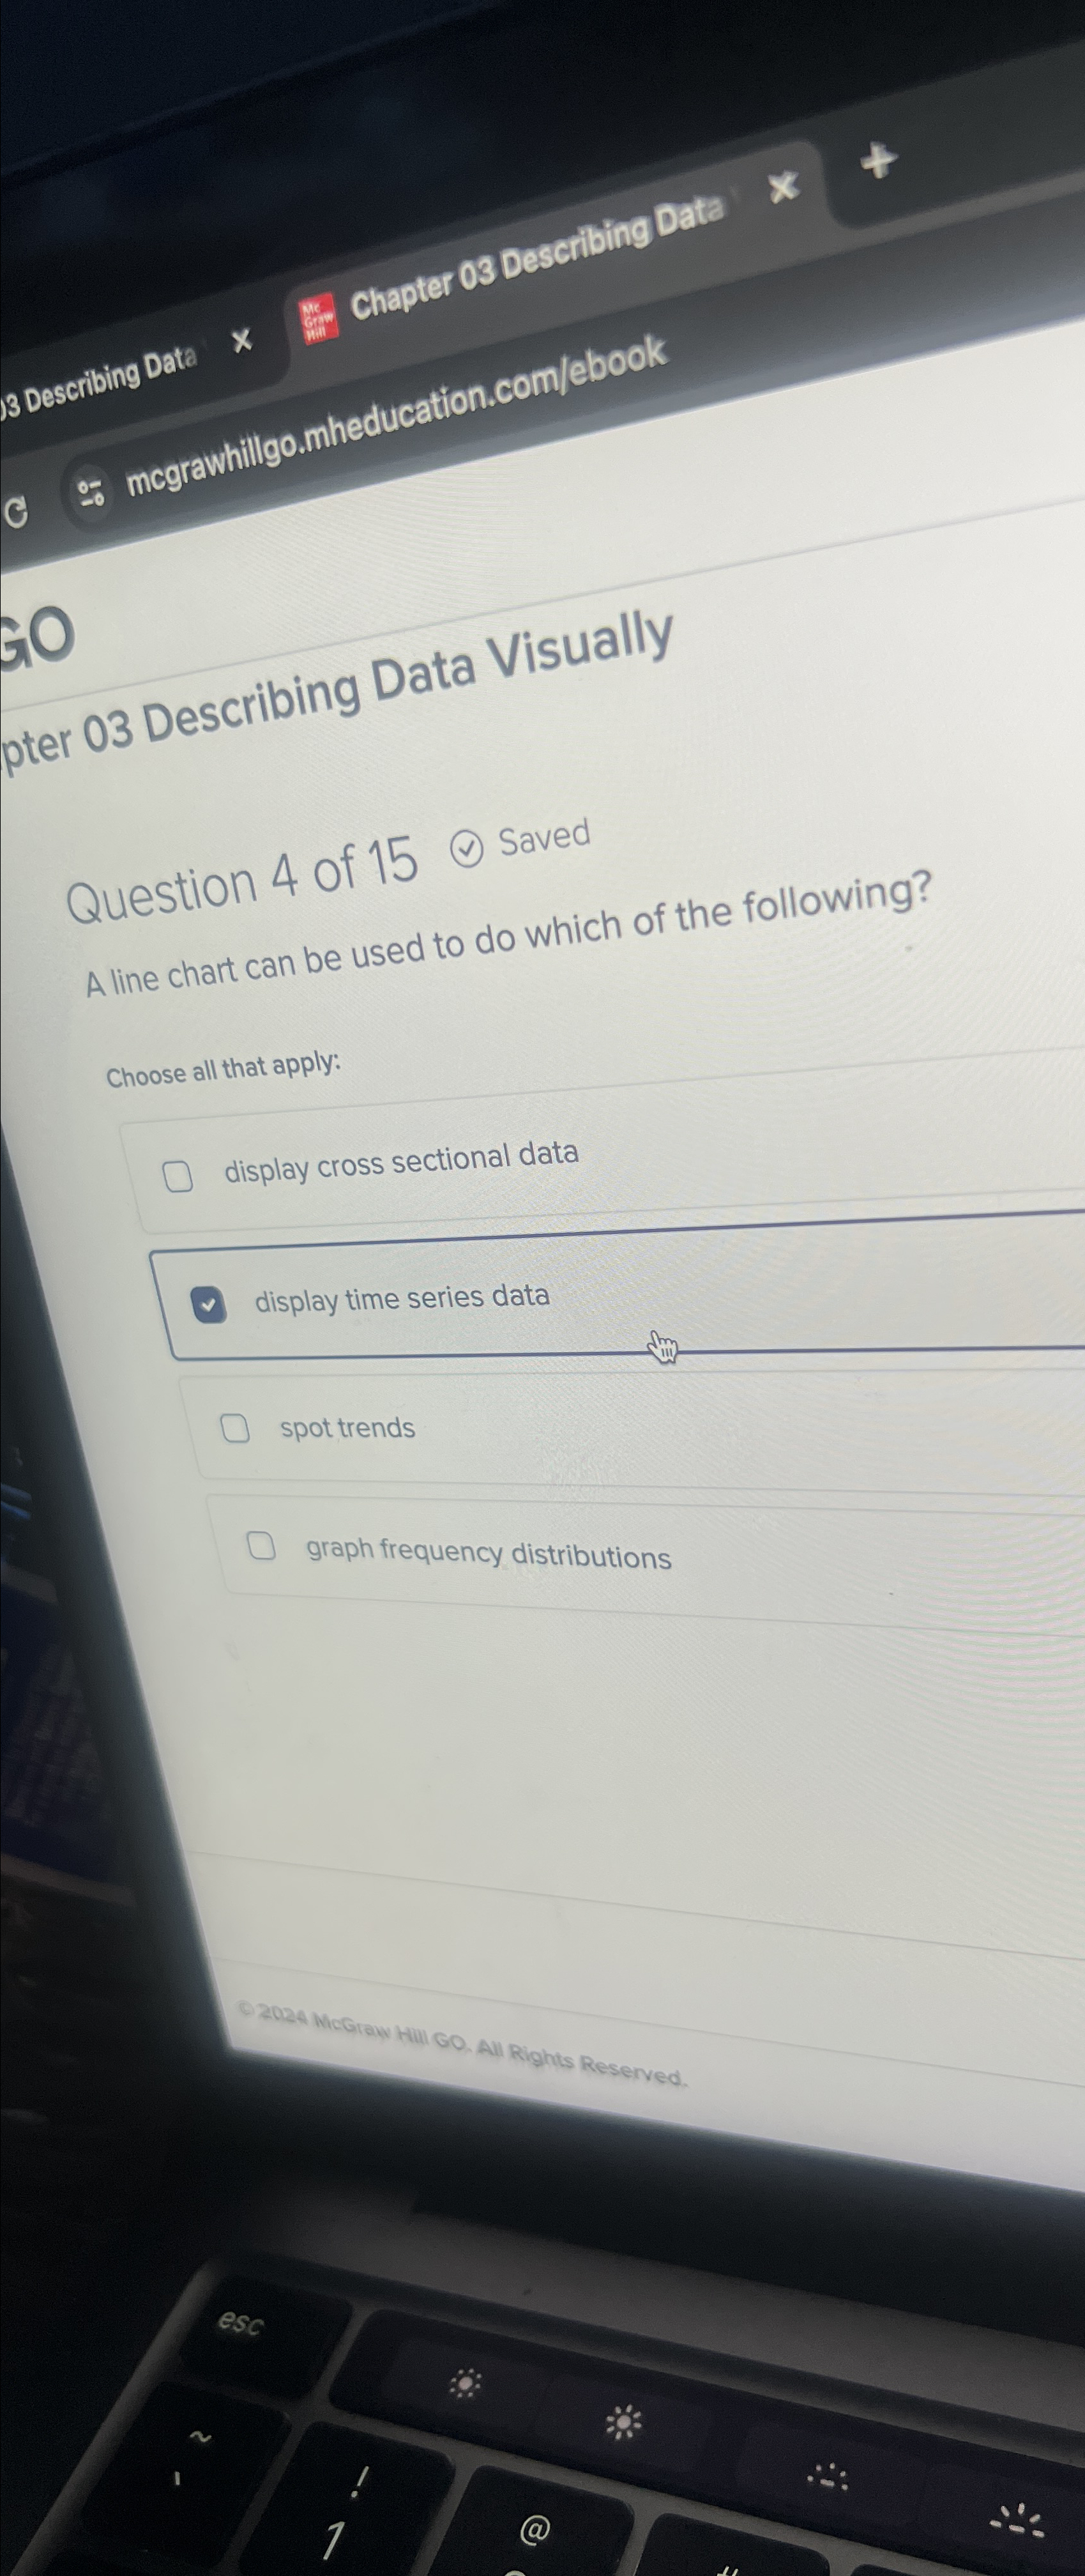
A line chart can be used to do which of the following?
Choose all that apply:
display cross sectional data
display time series data
spot trends
graph frequency distributions
Step by Step Solution
There are 3 Steps involved in it
1 Expert Approved Answer
Step: 1 Unlock

Question Has Been Solved by an Expert!
Get step-by-step solutions from verified subject matter experts
Step: 2 Unlock
Step: 3 Unlock