

Question: #3. E Data showing a monthly electrical bill vs avg monthly temperature (F) is shown below. (a) (b) (c) Determine the correlation between electricity
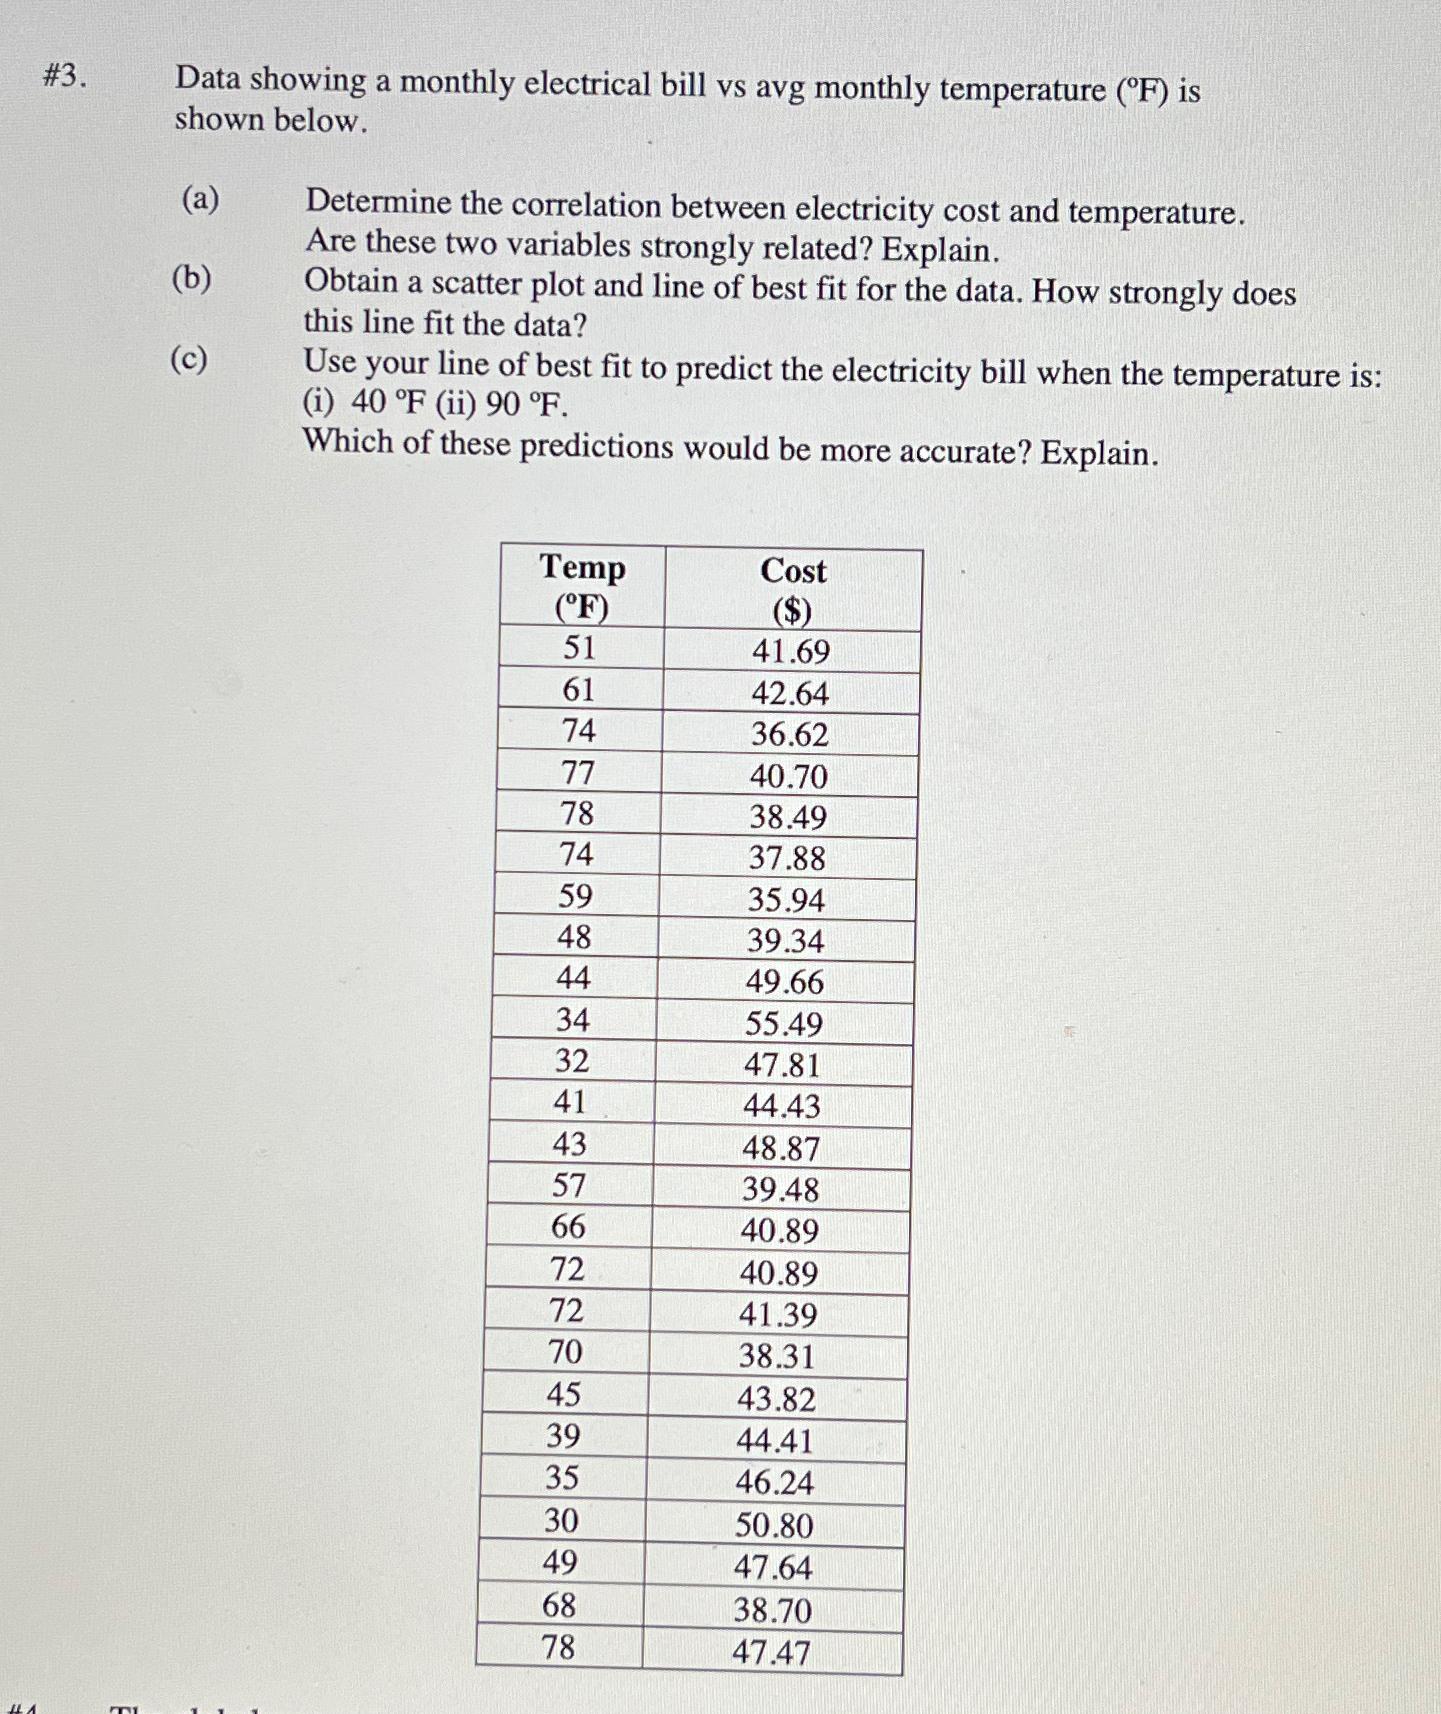
#3. E Data showing a monthly electrical bill vs avg monthly temperature (F) is shown below. (a) (b) (c) Determine the correlation between electricity cost and temperature. Are these two variables strongly related? Explain. Obtain a scatter plot and line of best fit for the data. How strongly does this line fit the data? Use your line of best fit to predict the electricity bill when the temperature is: (i) 40 F (ii) 90 F. Which of these predictions would be more accurate? Explain. Temp (F) 51 61 74 77 78 74 59 48 44 34 32 41 43 57 66 72 72 70 45 39 35 30 49 68 78 Cost ($) 41.69 42.64 36.62 40.70 38.49 37.88 35.94 39.34 49.66 55.49 47.81 44.43 48.87 39.48 40.89 40.89 41.39 38.31 43.82 44.41 46.24 50.80 47.64 38.70 47.47
Step by Step Solution
There are 3 Steps involved in it

Get step-by-step solutions from verified subject matter experts