

Question: 3. Exploratory data analysis In this question, you are asked to perform some exploratory data analysis. You will use the dataset Nile, which is already
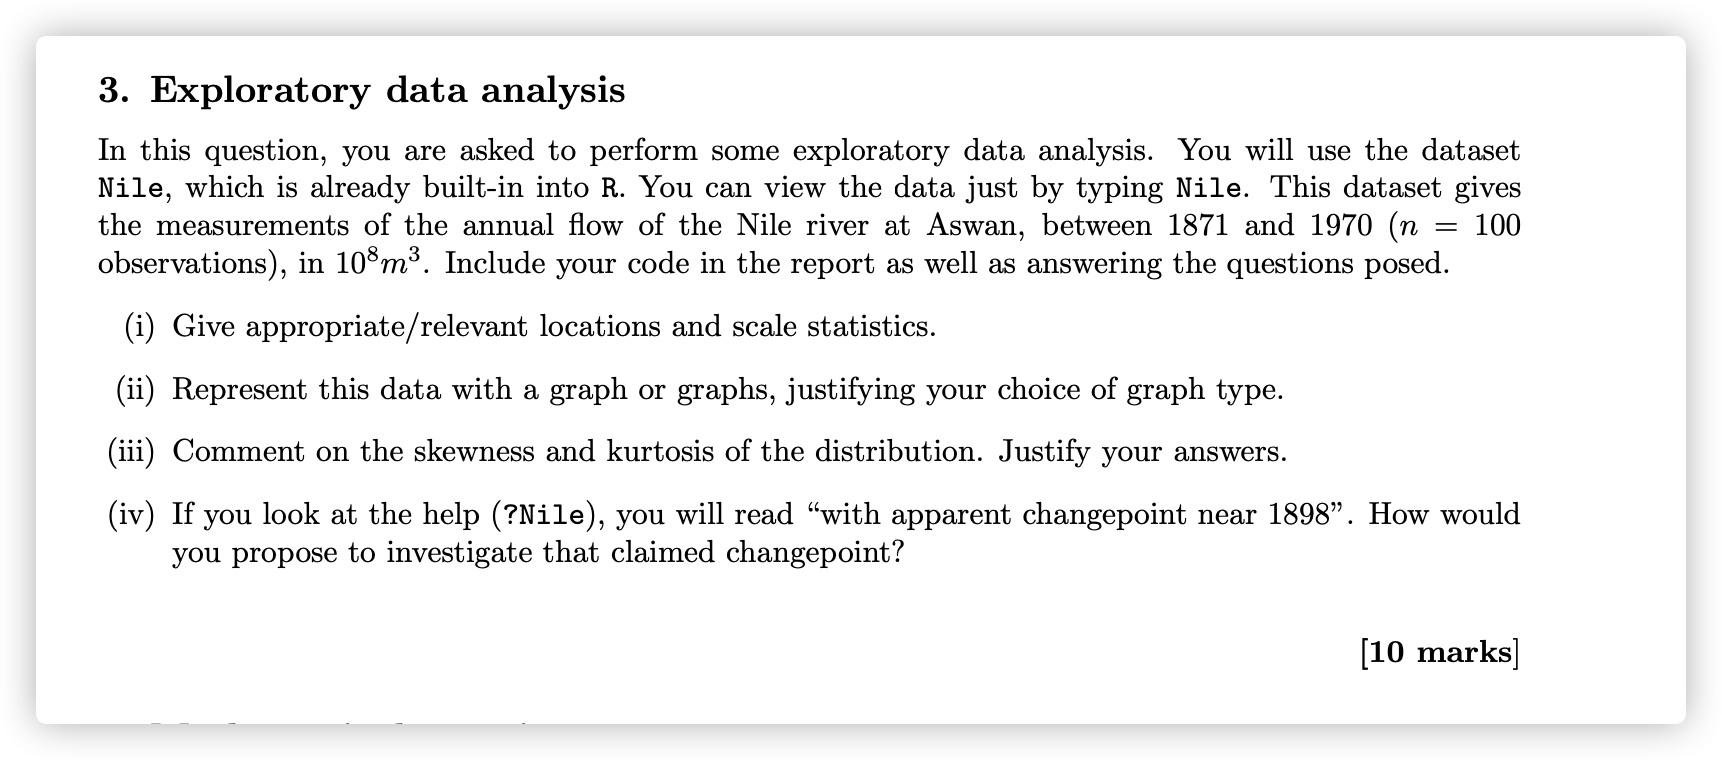
3. Exploratory data analysis In this question, you are asked to perform some exploratory data analysis. You will use the dataset Nile, which is already built-in into R. You can view the data just by typing Nile. This dataset gives the measurements of the annual flow of the Nile river at Aswan, between 1871 and 1970 (n 100 observations), in 108m'. Include your code in the report as well as answering the questions posed. (i) Give appropriate/relevant locations and scale statistics. (ii) Represent this data with a graph or graphs, justifying your choice of graph type. (iii) Comment on the skewness and kurtosis of the distribution. Justify your answers. (iv) If you look at the help (?Nile), you will read with apparent changepoint near 1898. How would you propose to investigate that claimed changepoint? (10 marks] 3. Exploratory data analysis In this question, you are asked to perform some exploratory data analysis. You will use the dataset Nile, which is already built-in into R. You can view the data just by typing Nile. This dataset gives the measurements of the annual flow of the Nile river at Aswan, between 1871 and 1970 (n 100 observations), in 108m'. Include your code in the report as well as answering the questions posed. (i) Give appropriate/relevant locations and scale statistics. (ii) Represent this data with a graph or graphs, justifying your choice of graph type. (iii) Comment on the skewness and kurtosis of the distribution. Justify your answers. (iv) If you look at the help (?Nile), you will read with apparent changepoint near 1898. How would you propose to investigate that claimed changepoint? (10 marks]
Step by Step Solution
There are 3 Steps involved in it

Get step-by-step solutions from verified subject matter experts