

Question: 3. Figure 4.7 shows a causal loop diagram indicating plausible relationships between key variables relative to the problem of illegal immigration in the United States.
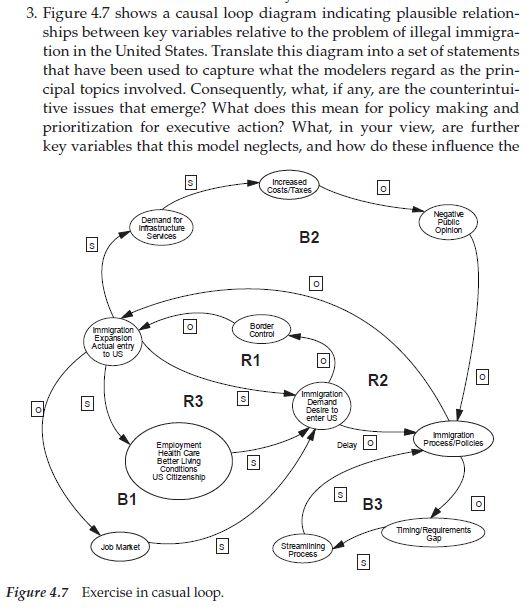
3. Figure 4.7 shows a causal loop diagram indicating plausible relationships between key variables relative to the problem of illegal immigration in the United States. Translate this diagram into a set of statements that have been used to capture what the modelers regard as the principal topics involved. Consequently, what, if any, are the counterintuitive issues that emerge? What does this mean for policy making and prioritization for executive action? What, in your view, are further key variables that this model neglects, and how do these influence the Fuyure 4., Extilise nilasual iveg. construction of a more relevant model? Construct the model in Figure 4.7 using the rules of causal loop diagramming
Step by Step Solution
There are 3 Steps involved in it

Get step-by-step solutions from verified subject matter experts