

Question: 3. Financial analysis: please use the attached financial reports Summarize your year-to-year financial analysis results in a table Interpretation of the results are required: you
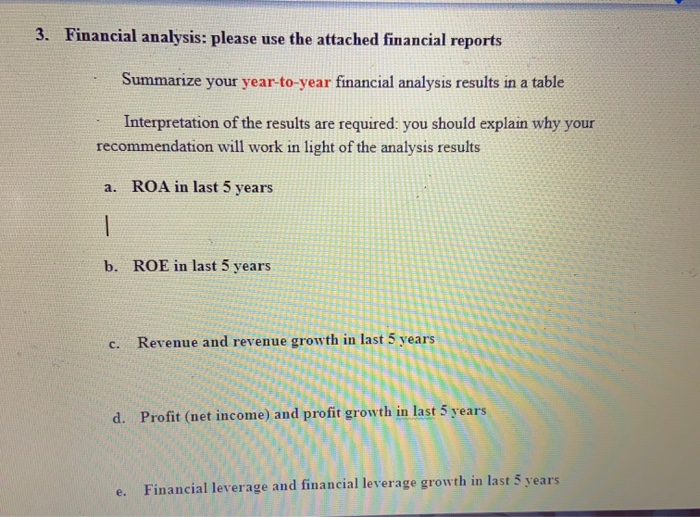
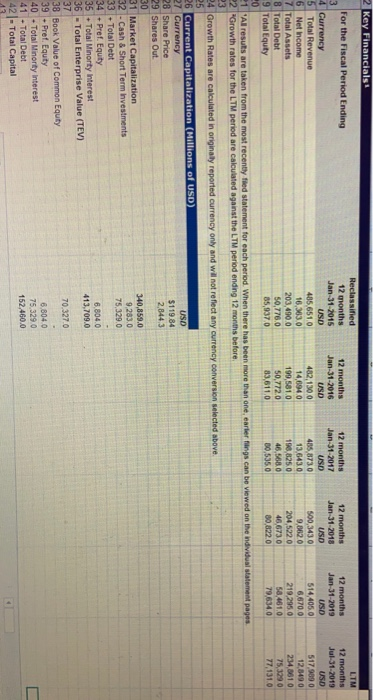
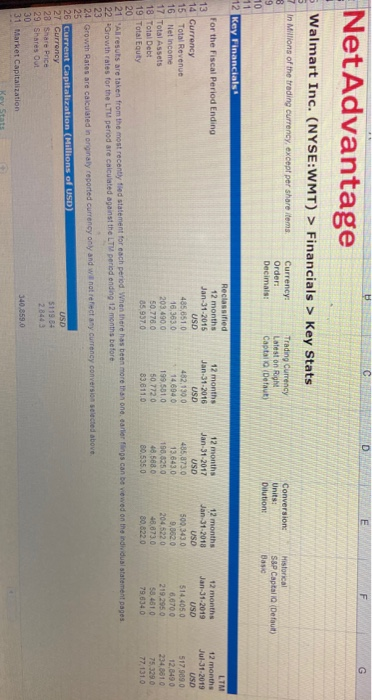
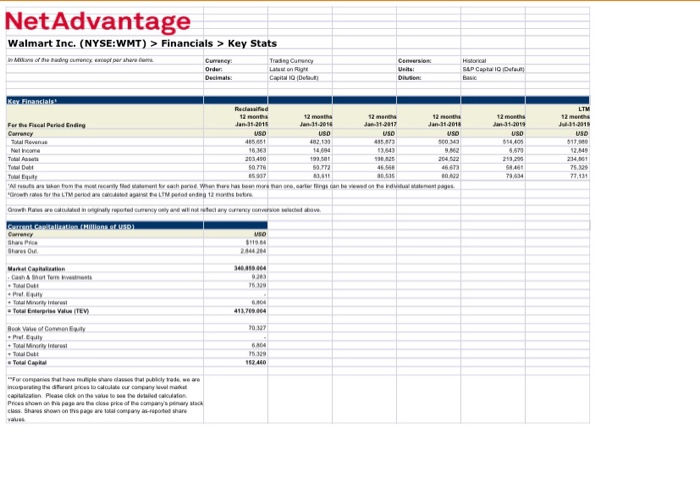
3. Financial analysis: please use the attached financial reports Summarize your year-to-year financial analysis results in a table Interpretation of the results are required: you should explain why your recommendation will work in light of the analysis results a. ROA in last 5 years b. ROE in last 5 years c. Revenue and revenue growth in last d. Profit (net income) and pro rowth e. Financial leverage and financial leverage growth in last 5 years 2 Key Financials: For the Fiscal Period Ending Reclassified 12 months Jan-31-2015 LIM 12 months Jul-31-2019 USD 4 Currency 5 Total Revenue 6 Net Income 7 Total Assets 8 Total Debt 9 Total Equity 405.6510 16.3830 203,490.0 50,776,0 85,9370 12 months Jan-31-2016 USD 482,1300 14,0940 199,581.0 50,772.0 83,611.0 12 months Jan-31-2017 USD 405 8730 13.6430 190,8259 46.9080 30,5359 12 months Jan-31-2018 USD 500,3430 9,8620 204,5220 46,6730 10,0220 12 months Jan-31-2019 USD 514,405.0 6,570.0 219.295.0 58.4010 79.634.0 517.000 12,5490 234,861 0 75,3230 77,131.0 viewed on the individual statement pages -1 Al resuts are taken from the most recently the statement for each period. When there has been more than one 2 "Growth rates for the LTM period are calculated against the LTM period ending 12 months before 24 Growth Rates are calculated in originally reported currency only and will not reflect any currency conversion selected above 26 Current Capitalization (Millions of USD 27 Currency 28 Share Price 29 Shares Out USD $119.84 2.0443 340,859.0 9.203.0 75.329.0 6.8040 413,709.0 31 Market Capitalization 32 - Cash & Short Term Investments 33 - Total Debt 34 Pref. Equity 35 - Total Minorty Interes! 36 - Total Enterprise Value (TEV) 37 38 Book Value of Common Equity 39 - Pref. Equity 40 - Total Minority interest 41 - Total Debt 42 - Total Capital 70.327.0 6.8040 75 3290 152.460.0 EFG NetAdvantage nin 5 Walmart Inc. (NYSE:WMT) > Financials > Key Stats In Mwions of the trading currency, except per share items Currency: Order: Decimals: Trading currency Latest on right Captal (Default) Conversion Units: Dilution Historical S&P Captal Default) Bas 12 Key Financials 12 months Jan-31-2017 USD For the Fiscal Period Ending 13 14 Currency 15 Total Revenue 16 Net Income 17 Total Assets 18 Total Debt 19 Total Equity Reclassified 12 months Jan-31-2015 USD 485,851.0 16.363 0 203.490.0 50.7780 85.9370 12 months Jan 31.2016 USD 402,139.0 14.6940 199.581.0 50.7720 83,011.0 435,0730 13.643.0 190.8250 46,5880 80.535.0 12 months Jan 31-2018 USD 500.343.0 0.0020 204 5220 48.673.0 80,8220 12 months Jan-31-2019 USD $14.405.0 6,670.0 219.250 $0.410 79.6340 LTM 12 months Jul 31 2019 USO 517 0090 12,649.0 234.010 75.3290 77 1310 20 21 Allrests are taken from the most recently the statement for each period when there has been more than one canon s can be viewed on the individual statement pages. 22 Growth rates for the LT period are calculated against the LT period ending 12 months before ted above 24 Growth Rates are calculated in orginaly reported currency on y and we not reflect any currency conversios 25 26 Current Capitalization Millions of USD 27 Currency $119.6+ 28 Share Price 29 Shares Out 30 31 Market Capitalization 340.29 Key Stats NetAdvantage Walmart Inc. (NYSE:WMT) > Financials > Key Stats Man or the day coney cep por share Trading Care SIUP Capital O n For the real Pure Ending Total Equity We are on hartha LM l y for each prod. When there has been more than one earlier ingen te viewed on the da Model 12 ore m ages L Qwth as wreedingly reported currently and will not any currency W e b Gent Caption to USD Shares ou MartCaption Cash A rt Terre Pretty Total Enterprise Vue (TEM) 90.327 Book Value of Common Prel. Equy Total Minty interest Total Dutt **For companies that have Incorporating th e plehre la publiclytae we are locale our company olmak Prices shown on this page are the close price of the companyi a class. Shansson on this page are company reported Share 3. Financial analysis: please use the attached financial reports Summarize your year-to-year financial analysis results in a table Interpretation of the results are required: you should explain why your recommendation will work in light of the analysis results a. ROA in last 5 years b. ROE in last 5 years c. Revenue and revenue growth in last d. Profit (net income) and pro rowth e. Financial leverage and financial leverage growth in last 5 years 2 Key Financials: For the Fiscal Period Ending Reclassified 12 months Jan-31-2015 LIM 12 months Jul-31-2019 USD 4 Currency 5 Total Revenue 6 Net Income 7 Total Assets 8 Total Debt 9 Total Equity 405.6510 16.3830 203,490.0 50,776,0 85,9370 12 months Jan-31-2016 USD 482,1300 14,0940 199,581.0 50,772.0 83,611.0 12 months Jan-31-2017 USD 405 8730 13.6430 190,8259 46.9080 30,5359 12 months Jan-31-2018 USD 500,3430 9,8620 204,5220 46,6730 10,0220 12 months Jan-31-2019 USD 514,405.0 6,570.0 219.295.0 58.4010 79.634.0 517.000 12,5490 234,861 0 75,3230 77,131.0 viewed on the individual statement pages -1 Al resuts are taken from the most recently the statement for each period. When there has been more than one 2 "Growth rates for the LTM period are calculated against the LTM period ending 12 months before 24 Growth Rates are calculated in originally reported currency only and will not reflect any currency conversion selected above 26 Current Capitalization (Millions of USD 27 Currency 28 Share Price 29 Shares Out USD $119.84 2.0443 340,859.0 9.203.0 75.329.0 6.8040 413,709.0 31 Market Capitalization 32 - Cash & Short Term Investments 33 - Total Debt 34 Pref. Equity 35 - Total Minorty Interes! 36 - Total Enterprise Value (TEV) 37 38 Book Value of Common Equity 39 - Pref. Equity 40 - Total Minority interest 41 - Total Debt 42 - Total Capital 70.327.0 6.8040 75 3290 152.460.0 EFG NetAdvantage nin 5 Walmart Inc. (NYSE:WMT) > Financials > Key Stats In Mwions of the trading currency, except per share items Currency: Order: Decimals: Trading currency Latest on right Captal (Default) Conversion Units: Dilution Historical S&P Captal Default) Bas 12 Key Financials 12 months Jan-31-2017 USD For the Fiscal Period Ending 13 14 Currency 15 Total Revenue 16 Net Income 17 Total Assets 18 Total Debt 19 Total Equity Reclassified 12 months Jan-31-2015 USD 485,851.0 16.363 0 203.490.0 50.7780 85.9370 12 months Jan 31.2016 USD 402,139.0 14.6940 199.581.0 50.7720 83,011.0 435,0730 13.643.0 190.8250 46,5880 80.535.0 12 months Jan 31-2018 USD 500.343.0 0.0020 204 5220 48.673.0 80,8220 12 months Jan-31-2019 USD $14.405.0 6,670.0 219.250 $0.410 79.6340 LTM 12 months Jul 31 2019 USO 517 0090 12,649.0 234.010 75.3290 77 1310 20 21 Allrests are taken from the most recently the statement for each period when there has been more than one canon s can be viewed on the individual statement pages. 22 Growth rates for the LT period are calculated against the LT period ending 12 months before ted above 24 Growth Rates are calculated in orginaly reported currency on y and we not reflect any currency conversios 25 26 Current Capitalization Millions of USD 27 Currency $119.6+ 28 Share Price 29 Shares Out 30 31 Market Capitalization 340.29 Key Stats NetAdvantage Walmart Inc. (NYSE:WMT) > Financials > Key Stats Man or the day coney cep por share Trading Care SIUP Capital O n For the real Pure Ending Total Equity We are on hartha LM l y for each prod. When there has been more than one earlier ingen te viewed on the da Model 12 ore m ages L Qwth as wreedingly reported currently and will not any currency W e b Gent Caption to USD Shares ou MartCaption Cash A rt Terre Pretty Total Enterprise Vue (TEM) 90.327 Book Value of Common Prel. Equy Total Minty interest Total Dutt **For companies that have Incorporating th e plehre la publiclytae we are locale our company olmak Prices shown on this page are the close price of the companyi a class. Shansson on this page are company reported Share
Step by Step Solution
There are 3 Steps involved in it

Get step-by-step solutions from verified subject matter experts